Rockwell Automation Publication 1783-UM003G-EN-P - December 2012 93
Manage the Switch via the Device Manager Web Interface Chapter 3
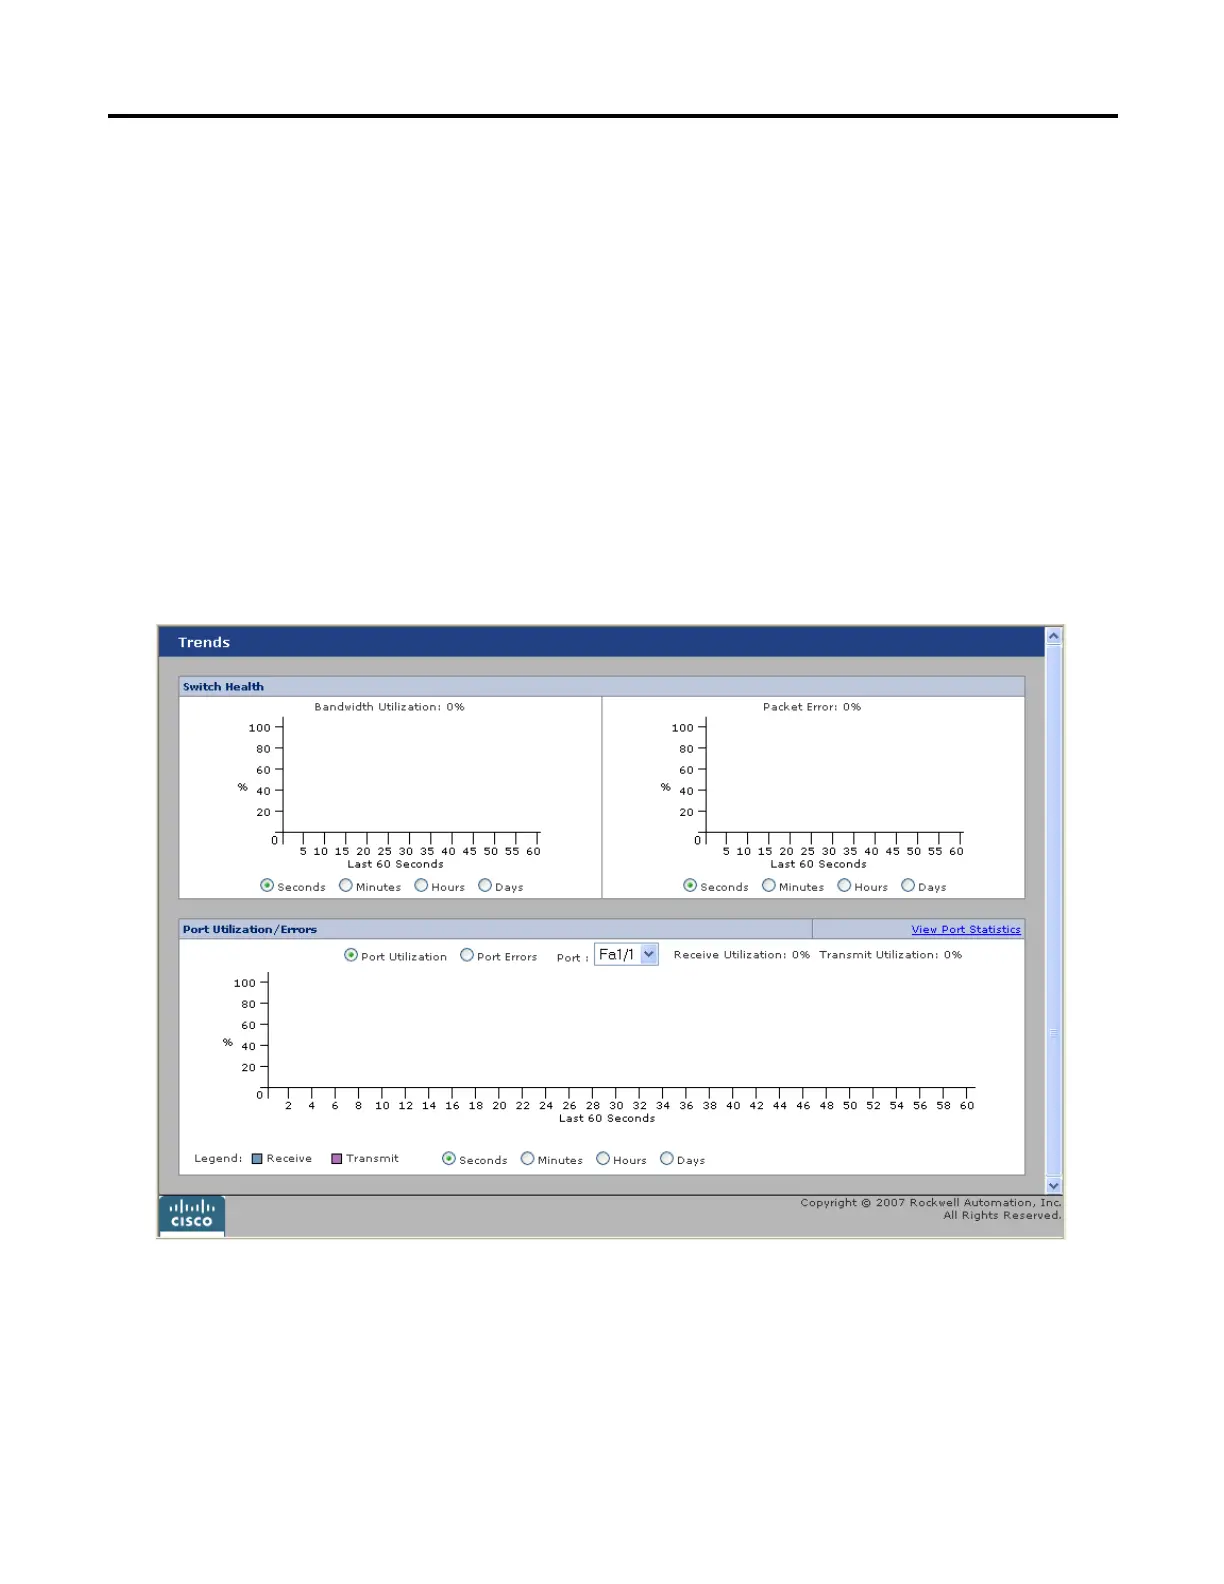
Trends Graphs
Use the Trends dialog box to display the historical trends graphs. Use these graphs
to display the switch bandwidth, the port usage, and the percentage of packet
errors detected by the switch. You can display the data in increments of seconds,
minutes, hours, and days. The level of detail displayed from these graphs can help
you to analyze traffic patterns and to identify problems with the switch and
individual ports.
To display the Trends dialog box choose Monitor>Trends. You can also click the
View Trends link from Dashboard.
If you are using the trends graphs to monitor the switch status
over time, do not end your Device Manager Web interface
session.
 Loading...