DRAFT
September 25, 2007 1:07 am, 4376782_Colocated_Installation.fm
Chapter 3 Install the Colocated Layout
Perform the RNase P Experiment
43
Applied Biosystems StepOne
™
and StepOnePlus
™
Real-Time PCR Systems
Installation, Networking, and Maintenance Guide
Notes
Analyze the Experiment
Review the data to confirm the results of the experiment.
Confirm the
Results of the
Analysis
Note: After the StepOne
™
software completes the RNase P run, it automatically
analyzes the run and displays the results in the Analysis screen.
1. In the Analysis screen of the RNase P Run wizard, confirm the status of the run:
• Passed – The instrument passed the RNase P run. Go to step 5 on page 45.
• Failed – The instrument failed the RNase P run. Go to step 2 to screen the
experiment for outliers.
If the run fails, the automated analysis may have included outliers that caused the
initial analysis to fail. Experimental error may cause some wells to be amplified
insufficiently or not at all. These wells typically produce C
T
values that differ
significantly from the average for the associated replicate wells. If included in the
calculations, these outlying data (outliers) can result in erroneous measurements.
2. In the Amplification Plot, select Ct vs. Well from the Plot Type dropdown menu.
3. Confirm the uniformity of each replicate population on the reaction plate (controls,
standards, and unknowns) by comparing the groupings of C
T
values:
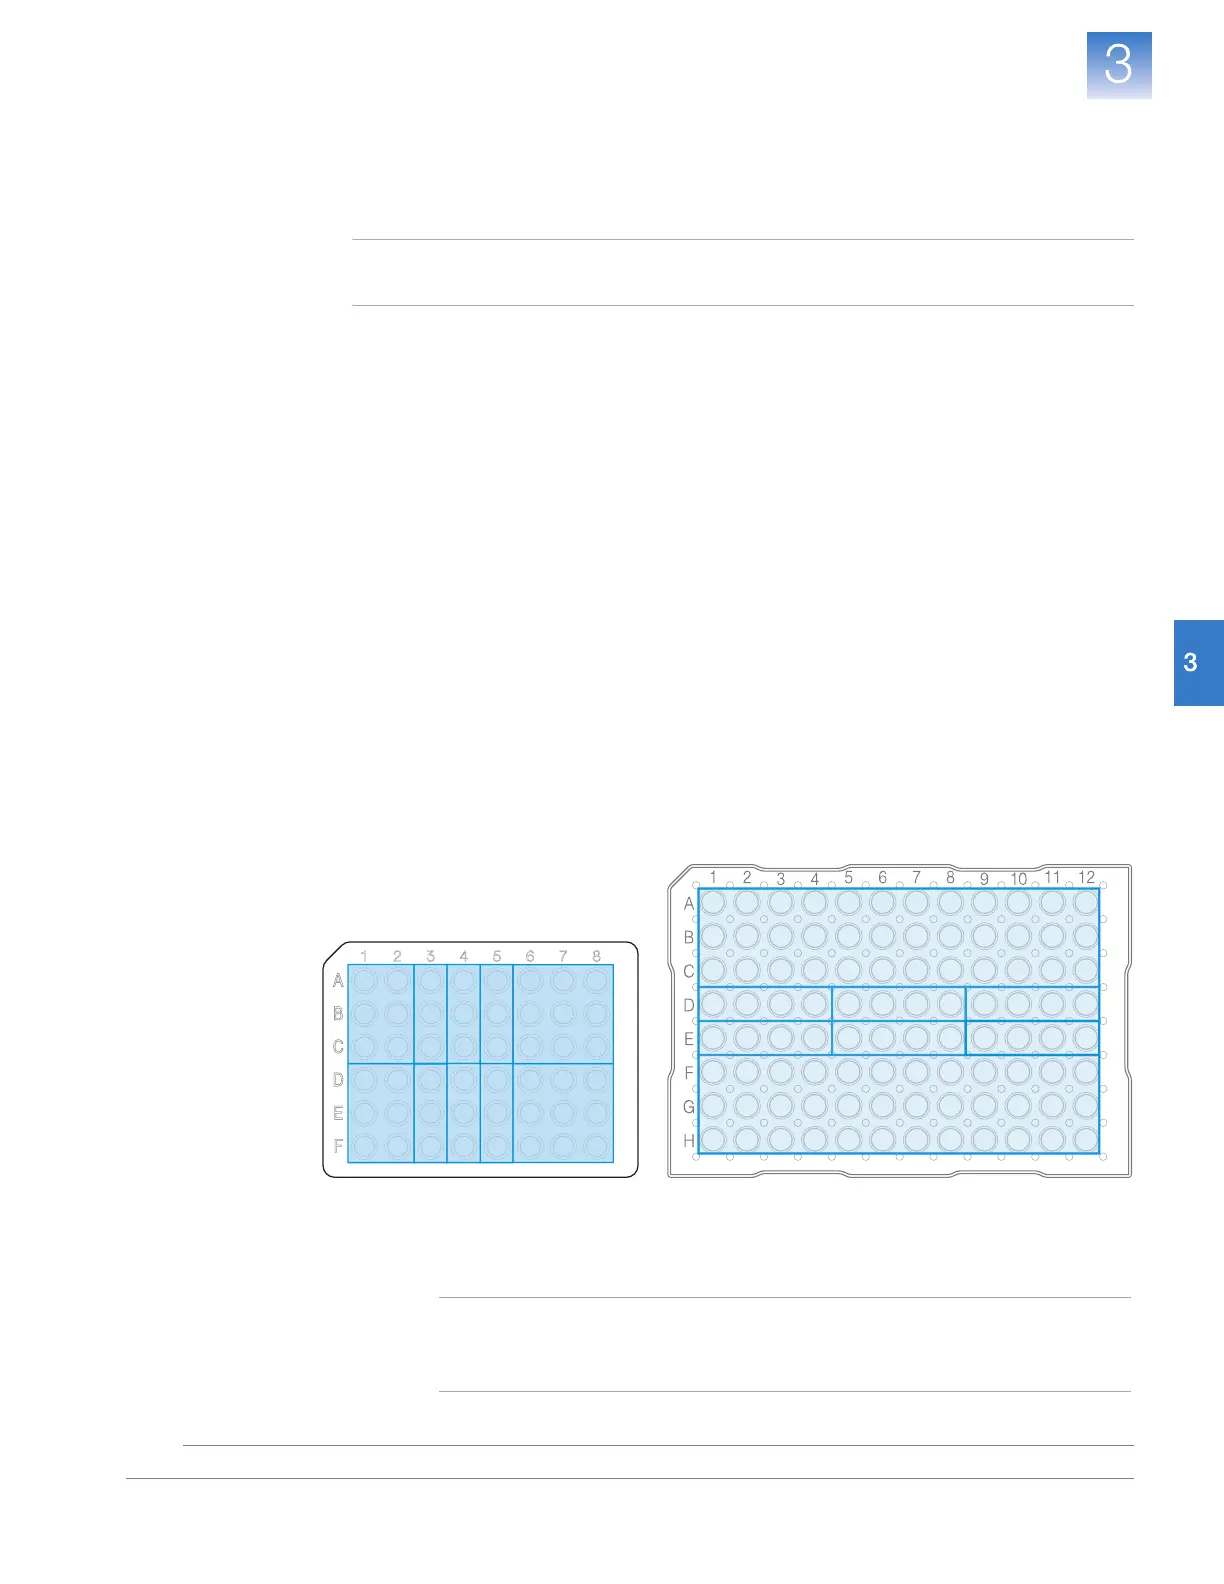
a. In the plate layout, select the wells containing the 10,000-copy unknown
population:
• StepOne
™
System – Wells from columns 1, 2, 6, 7, and 8 in rows D, E, and F
• StepOnePlus
™
System – Wells rows F, G, and H
b. In the plot, confirm that the C
T
s of the replicate population are equivalent.
Note: The numbers on the X-axis of the plot correspond to the wells of the
reaction plate. Beginning with well A1, the wells are numbered from left-to-
right, and top-to-bottom.
5K-copy Unknown
Population 1
10K-copy Unknown
Population 2
NC
STD 1250 STD 2500
STD 5000 STD 10000 STD 20000
Taq Man
®
96-well RNase P Plate for
the StepOnePlus
™
System
NC
STD 1.25K
STD 20K
STD 2.5KSTD 5K
STD 10K
10K-copy
Unknown
Population 2
10K-copy
Unknown
Population 2
5K-copy
Unknown
Population 1
5K-copy
Unknown
Population 1
TaqM an
®
48-well RNase P Plate for
the StepOne
™
System