Sweeps
Most de vice test ing with the 2700 series is per formed us ing sweeps. In a
sweep, a set ting is stepped over a pre-defined range, while se lected read ings
are gath ered. The re sult is a ta ble of data re lat ing the read ings to each value of
the set ting.
For in stance, if you wanted to mea sure the fre quency re sponse of an an a log
am pli fier, you might vary the fre quency of the An a log Gen er a tor from 20 Hz
to 20 kHz in 30 log a rith mic steps, while mon i tor ing the An a log An a lyzer
Chan nel A and Chan nel B level read ings. The re sult would be a ta ble of data
with 30 rows (one for each fre quency step) and 3 col umns (one for the fre -
quency set ting, one for the Chan nel A level read ing, and one for the Chan nel B
level read ing).
You can force the 2700 series to perform a “single-point
sweep” for special purposes, but generally the term sweep
indicates that a number of data points are included in the
measurement.
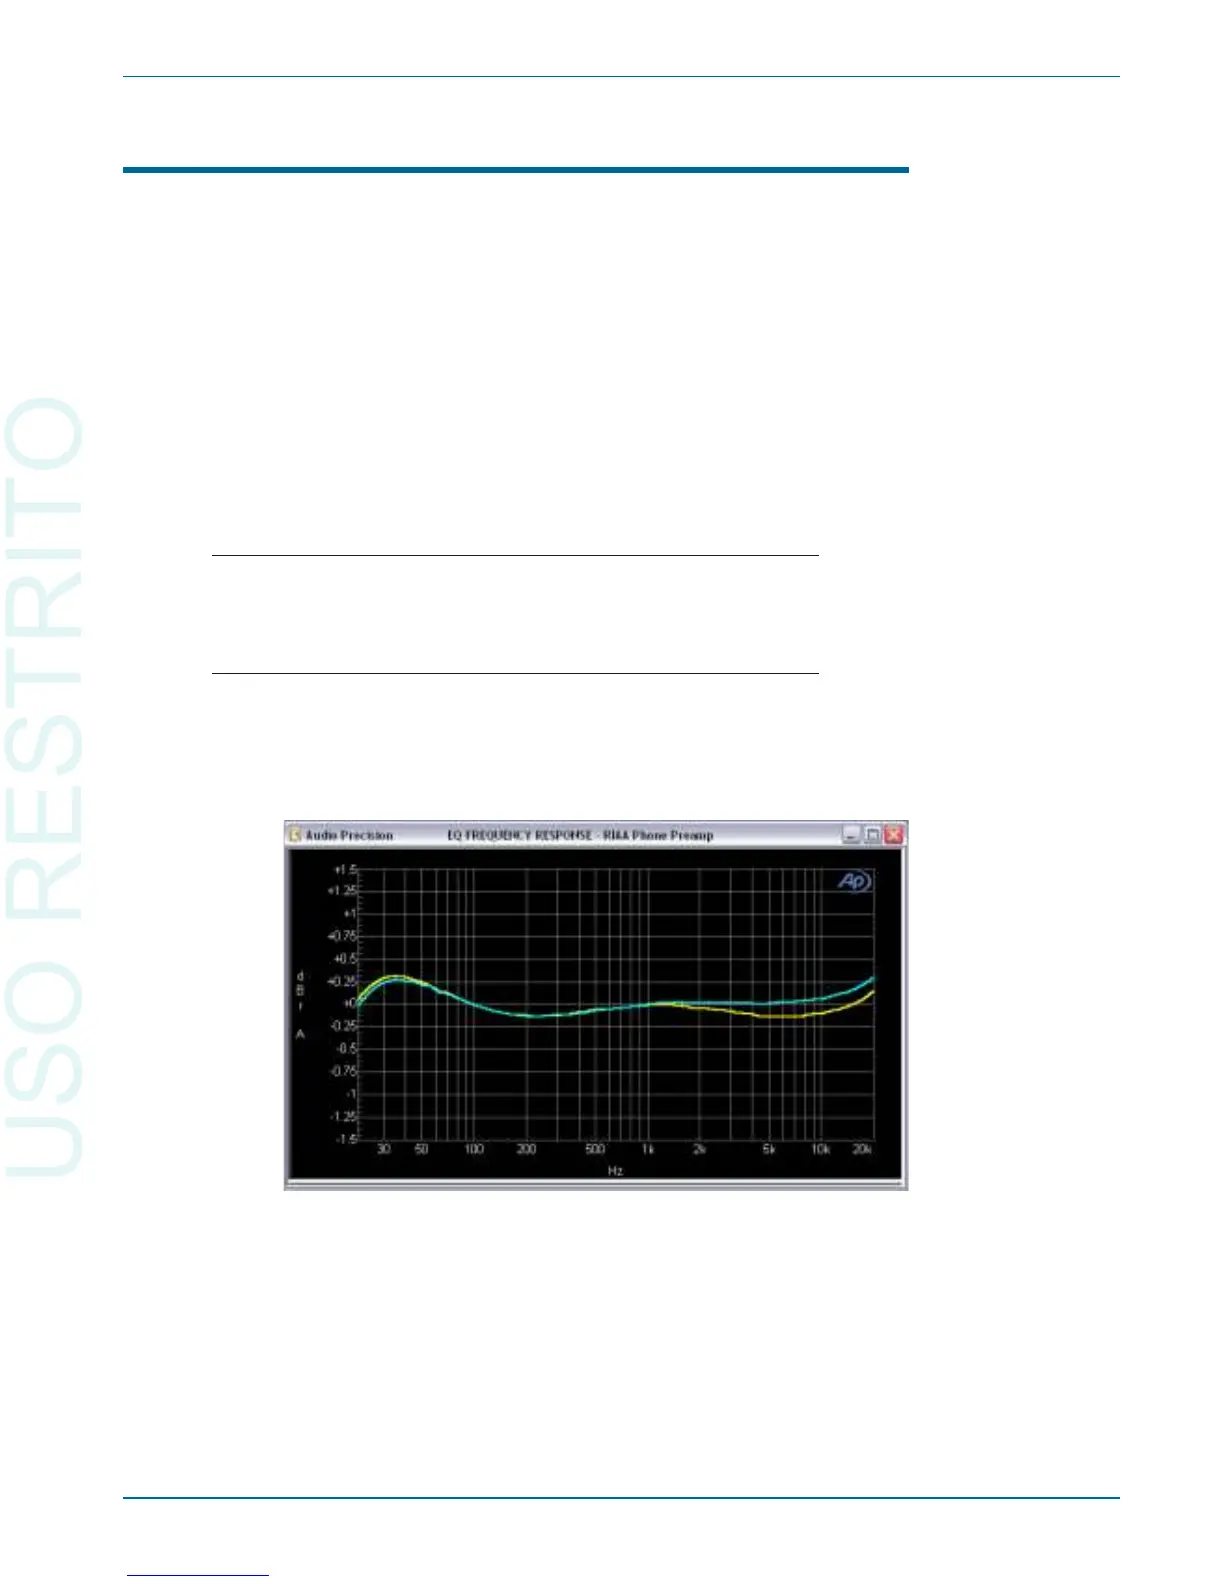
When a sweep is per formed, a graph is also cre ated. This is a graph i cal rep -
re sen ta tion of the data ob tained dur ing the sweep. Fig ure 22 shows an ex am ple
of a ste reo fre quency re sponse graph.
The Sweep panel con tains many more fea tures than are de scribed here. See
Chap ter 17 of the 2700 Se ries User’s Man ual for more in for ma tion.
Sweeps Chapter 5: Quick Guides
Getting Started with Your 2700 Series Instrument 39
Figure 22. A typical frequency response graph.