do main dis play re sults. If it is set to Fft.FFT Fre quency, a fre quency do main
dis play re sults.
The Sweep Spec trum/Wave form but ton in the Stan dard toolbar al lows
FFT sweeps to be set up quickly, en ter ing Fft.FFT Time or Fft.FFT Fre -
quency in the Source field and set ting de fault ranges. We will use this fea ture
to ex am ine har monic dis tor tion in the 2700 se ries.
Quick Sweep Setup
Click New Test, turn the An a log Gen er a tor ON, and set the An a log An a -
lyzer Source A and B to GenMon so that the gen er a tor sig nal is sent di rectly
to the an a log in put.
Now open the Dig i tal An a lyzer panel and switch to the Spec trum An a lyzer
by se lect ing FFT spec trum an a lyzer (fft) from the drop-down list.
Open the Sweep panel and click the Sweep Spec trum/Wave form but ton on
the Stan dard toolbar. The sweep is au to mat i cally set up for a ste reo fre quency
do main dis play from 20 Hz to 20 kHz.
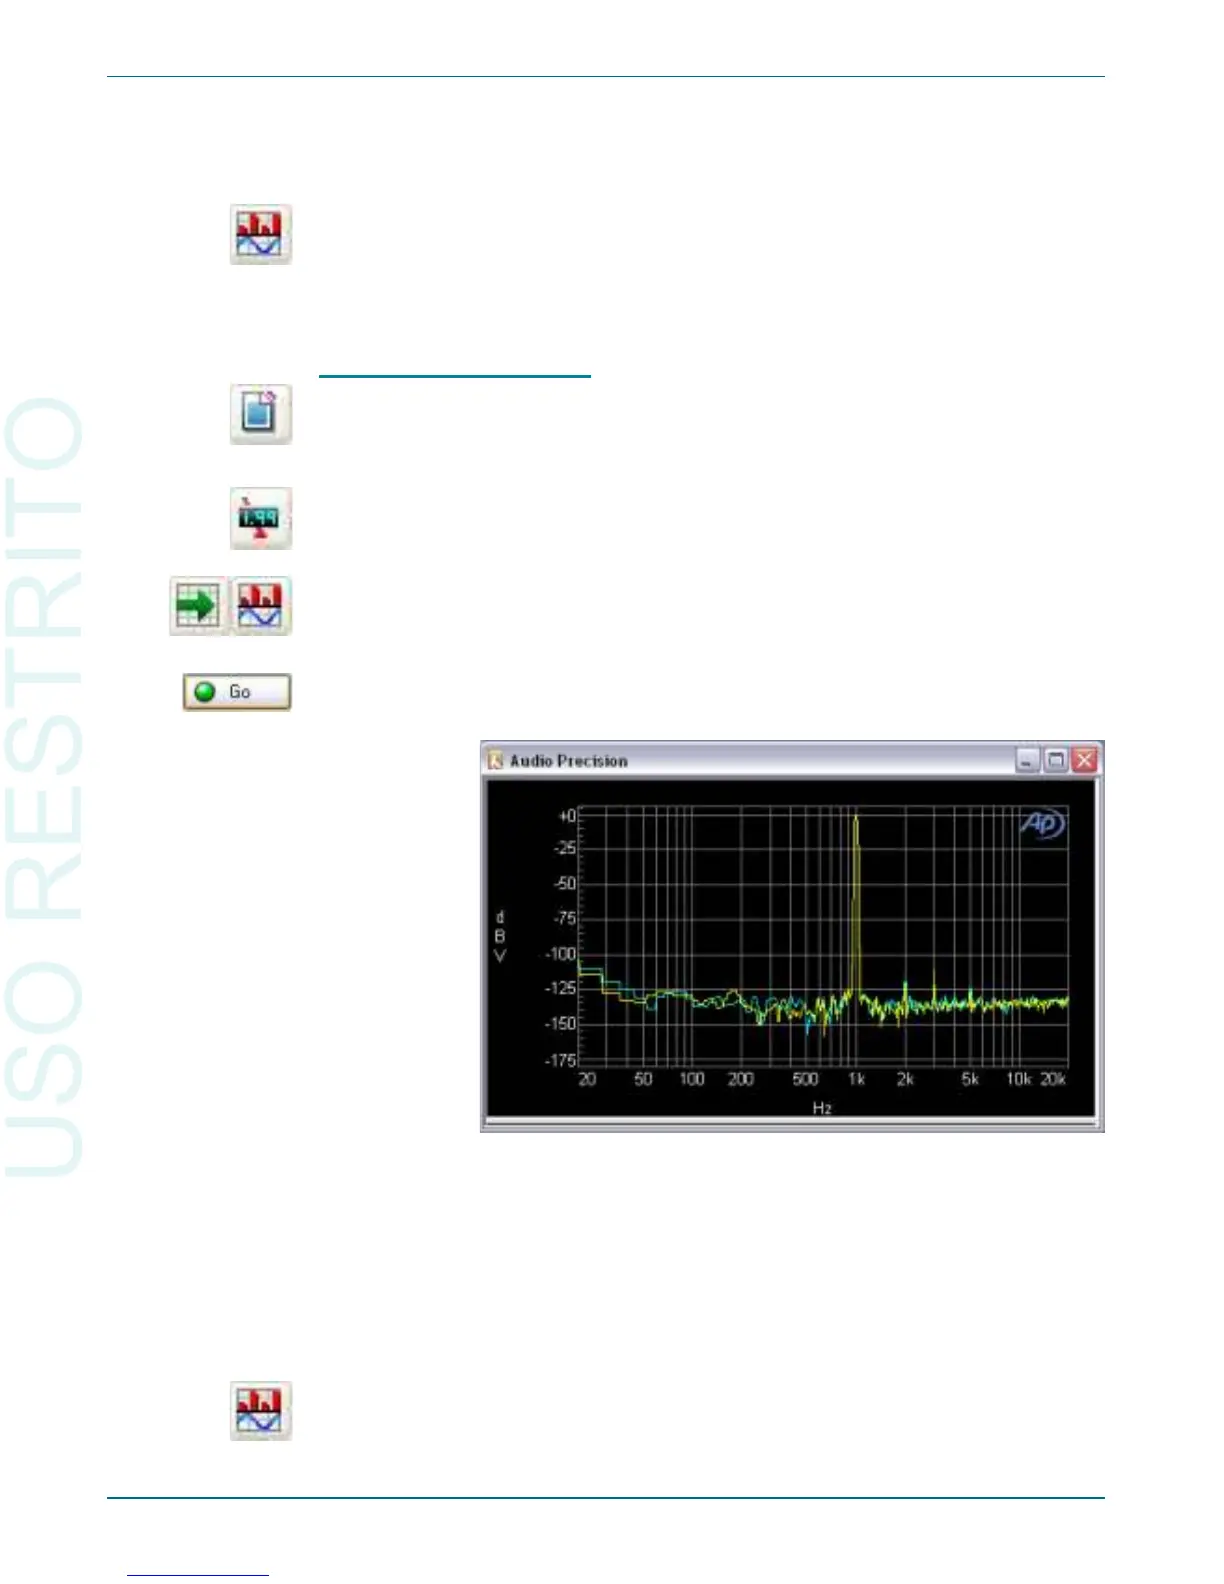
Click Go to per form the sweep. A graph sim i lar to Fig ure 29 is cre ated.
The large peak in the mid dle of the spec trum is the 1 kHz, 1 V sine wave
fun da men tal pro duced by the an a log gen er a tor. There are smaller peaks spaced
at 1 kHz in ter vals above the fun da men tal. These are har monic dis tor tion com -
po nents gen er ated in the 2700 se ries hard ware. These har mon ics rise out of a
wideband sys tem noise floor.
To look at the au dio sig nal in the time do main, click the Sweep Spec trum/
Wave form but ton again. Source 1 changes to Fft.FFT Time and the graph
up dates to show the new data. You should see a graph sim i lar to Fig ure 30.
Chapter 5: Quick Guides The FFT Spectrum Analyzer
48 Getting Started with Your 2700 Series Instrument
Figure 29. Typical default FFT stereo frequency domain graph.
 Loading...