field change also.) In the Top field, type 0.1. In the Bot tom field,
type –0.1.
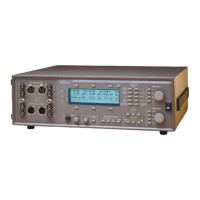
You can now click the Go but ton to run the sweep. A graph is cre ated, and
the re sponse is plot ted as the sweep pro gresses. If you are mon i tor ing us ing
the in ter nal speaker, you will hear the an a log gen er a tor fre quency step through
the au dio range. The re sult will be a re sponse curve that de vi ates only slightly
from 0 dBV, as shown in Fig ure 25.
Example Sweep: Amplitude Linearity
For this ex am ple, we will mea sure the am pli tude lin ear ity of the 2700 se ries
in stru ment. With the An a log Gen er a tor out put con nected to the An a log An a -
lyzer in put, we sweep the am pli tude of the An a log Gen er a tor over its full
range, and plot the ra tio of the level mea sured by the An a log Analyzer Level
me ters to the gen er a tor out put level, in dB. Any am pli tude non-lin ear ity in the
sys tem will show as a de vi a tion from 0 dB.
First, click New Test, turn the An a log Gen er a tor ON, and set the An a log
An a lyzer Source A and B to GenMon so that the gen er a tor sig nal is sent di -
Sweeps Chapter 5: Quick Guides
Getting Started with Your 2700 Series Instrument 43
Figure 25. Current workspace after frequency response sweep,
showing typical results.