Noise Signals
White Noise Bandwidth limited 10 Hz–23 kHz.
Pink Noise Bandwidth limited 20 Hz–200 kHz.
Bandpass Noise Approximately 1/3-octave (2-pole) filtered pink
noise, continuously tunable from 20 Hz–100 kHz.
Generator True random or pseudo-random.
Pseudo-Random Interval Typically 262 ms
(synchronized to the analyzer 4/s reading rate).
Amplitude Range
5
(Approximate calibration only).
Balanced 30 µVpp–37.7 Vpp.
Unbalanced 30 µVpp–18.8 Vpp.
Graphs of Typical Analog Generator Performance
Chapter 6: Specifications Analog Signal Outputs
54 Getting Started with Your 2700 Series Instrument
-120
-60
-115
-110
-105
-100
-95
-90
-85
-80
-75
-70
-65
d
B
0.0001
0.1
0.0002
0.0005
0.001
0.002
0.005
0.01
0.02
0.05
%
10 20k20 50 100 200 500 1k 2k 5k 10k
Hz
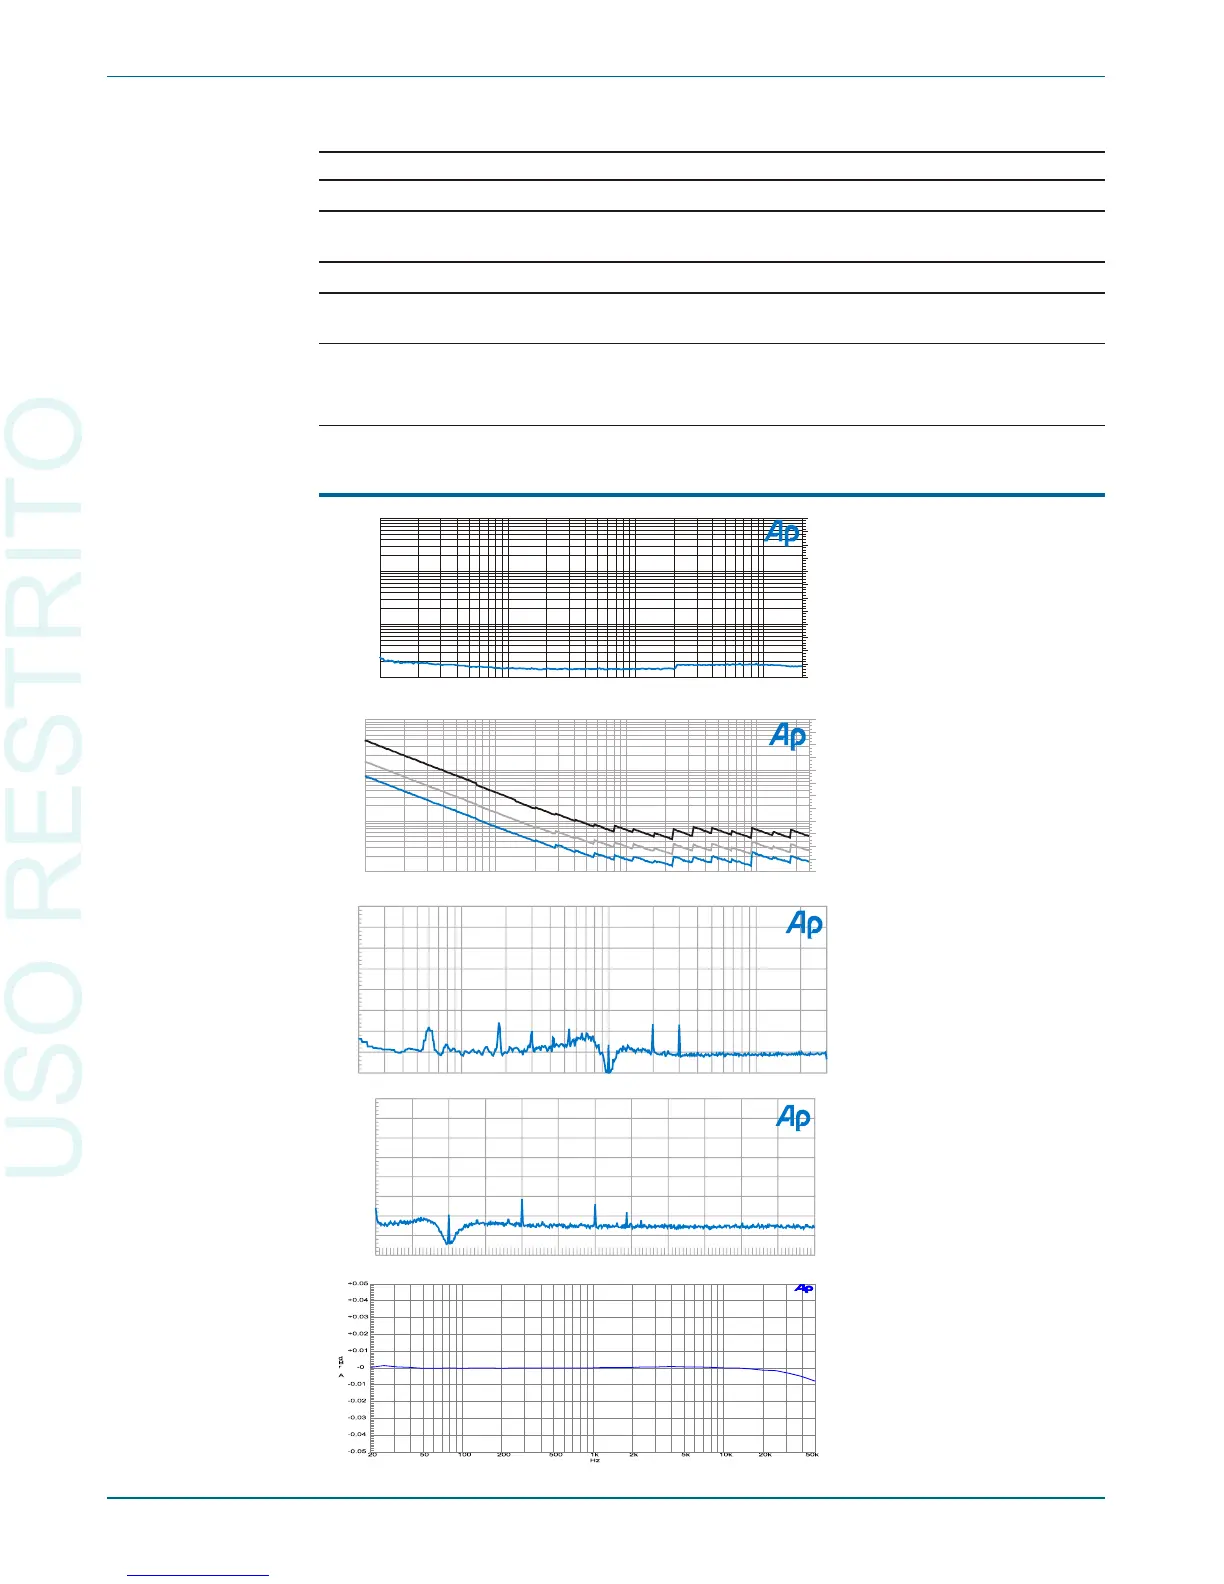
Figure 31. Typical system
THD+N versus
Frequency at 2 Vrms
(analog sine).
-120
-60
-115
-110
-105
-100
-95
-90
-85
-80
-75
-70
-65
d
B
0.0001
0.1
0.0002
0.0005
0.001
0.002
0.005
0.01
0.02
0.05
%
10m 2020m 50m 100m 200m 500m 1 2 5 10
Vrms
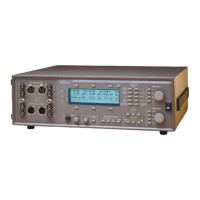
Figure 32. Typical system
THD+N versus amplitude at
1 kHz. Lower trace is with
22 kHz bandwidth limiting.
Middle trace is with 80 kHz.
-160
-80
-150
-140
-130
-120
-110
-100
-90
d
B
20 30k50 100 200 500 1k 2k 5k 10k 20k
Hz
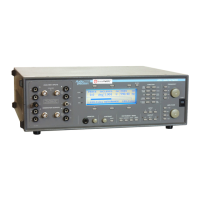
Figure 33. Typical residual
THD+N spectrum at 1 kHz,
2 Vrms. (32768 point FFT of
notch filter output, Sample
Rate = 65.536 ks/s, 16
averages).
-160
-80
-150
-140
-130
-120
-110
-100
-90
d
B
0 120k10k 20k 30k 40k 50k 60k 70k 80k 90k 100k 110k
Hz
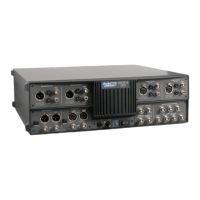
Figure 34. Typical residual
THD+N spectrum at 20 kHz,
2 Vrms. (32768 point FFT of
notch filter output, Sample
Rate = 262 ks/s, 16
averages).
Figure 35. Typical analog
system flatness at 2 Vrms
signal level (measured with
the analog analyzer’s Level
meter, dc input coupling).