CHAPTER43 System Status
Mediant 4000 SBC | User's Manual
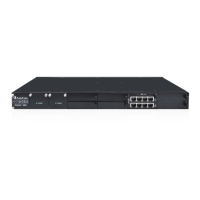
● The figure above is used only as an example as the graphical display of your device
in the Web interface reflects your specific ordered hardware configuration.
● For a description of the Monitor page when the device is in High Availability (HA)
mode, see HA Status Display on Monitor Web Page.
Table 43-2: Description of Graphical Display of Device on Monitor Page
Item #1 Description
1 Alarms: Displays the highest severity of an active alarm raised (if any) by
the device:
■ Green = no alarms
■ Red = Critical alarm
■ Orange = Major alarm
■ Yellow = Minor alarm
To view active alarms, click Alarms to open the Active Alarms page (see
Viewing Active Alarms).
2 Fan tray unit status icon:
■ (green): Normal operation of Fan tray.
■ (red): Fan tray failure.
To view detailed information of the device's hardware components, click
these icons to open the Components Status page (see Viewing Hardware
Components Status.
3 Power Supply Module 2 status icon:
■ (green): Normal operation of Power Supply module.
■ (red): Failure in Power Supply module or no Power Supply module is
installed.
To view detailed information of the device's hardware components, click
these icons to open the Components Status page (see Viewing Hardware
Components Status).
4 Power Supply module 1 status icon. For more information, see the
description above.
5 Module status icon:
■ (green): Module has been inserted or is correctly configured
■ (gray): Module was removed and "Reserved" is displayed
■ (red): Module failure and "Failure" is displayed
6 Chassis slot number.
- 730 -
 Loading...