KT (E6.1) 07/2015 Page 99/138
16. Graphical display of the measured values
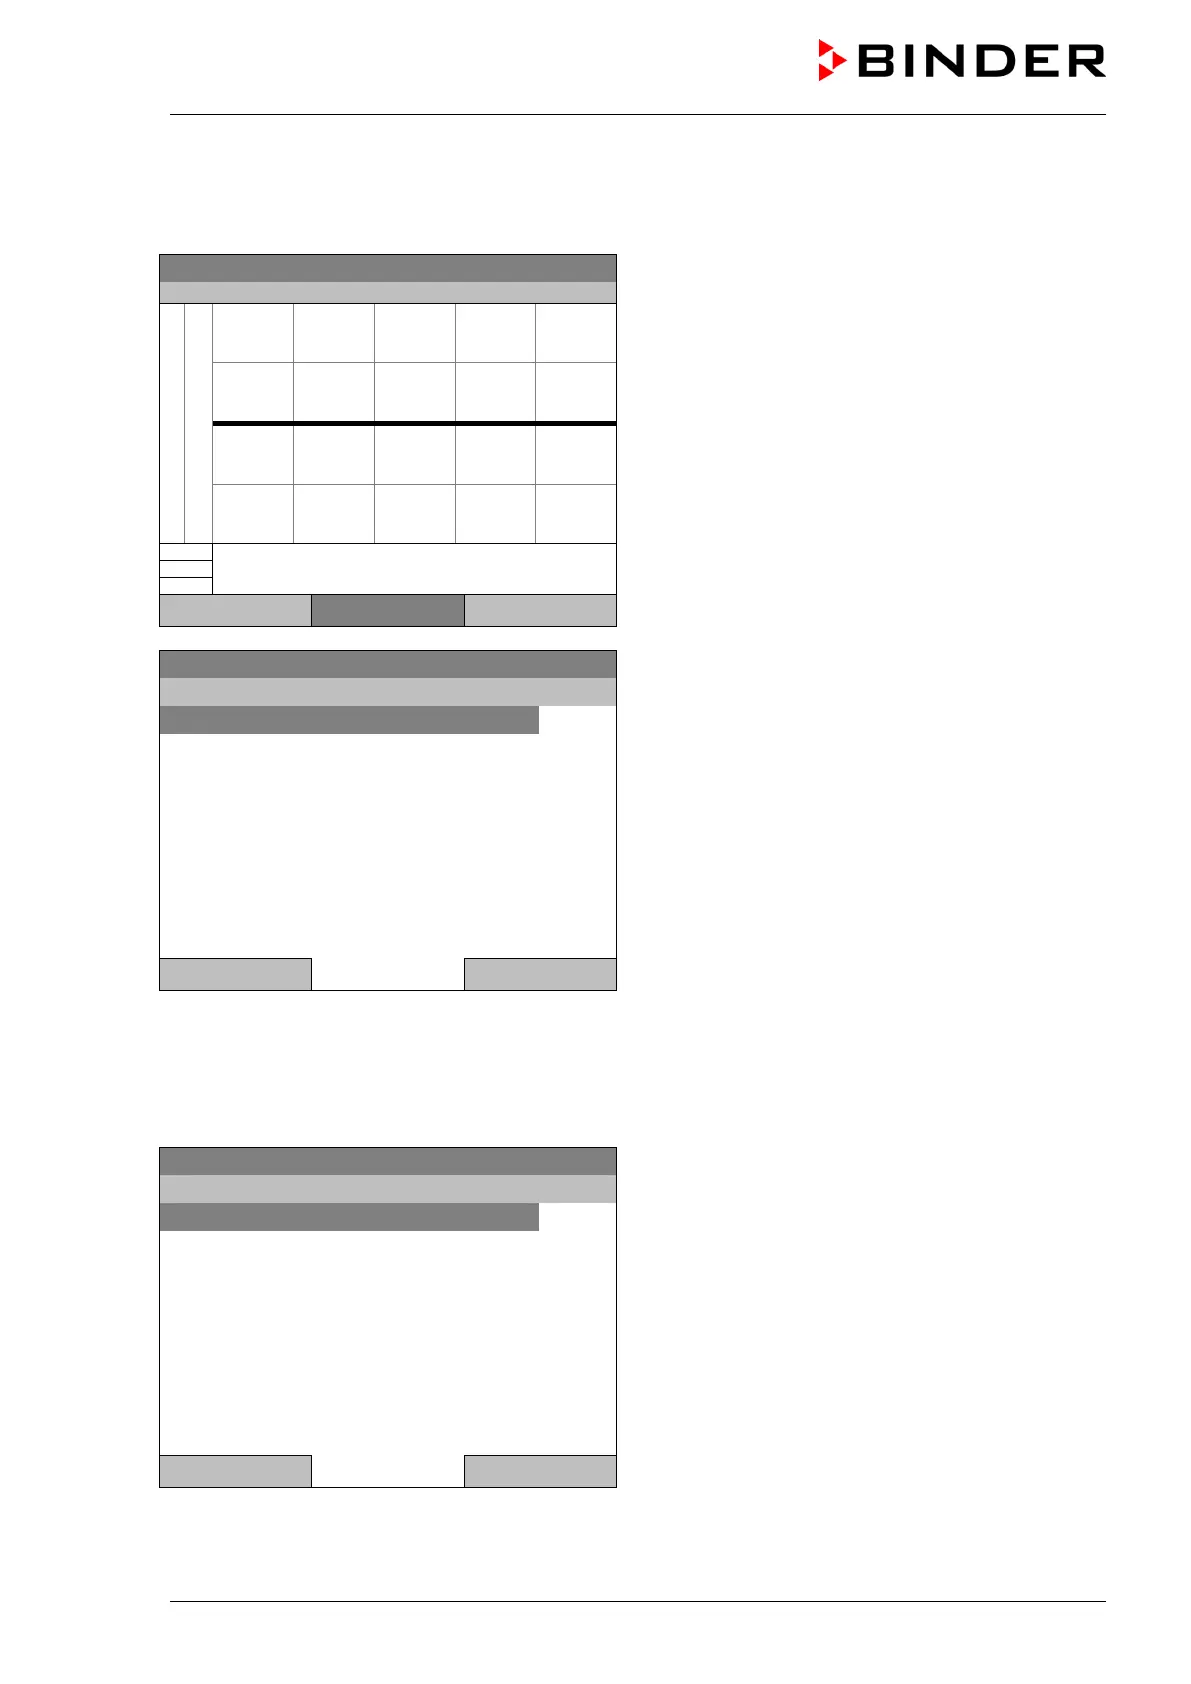
To access the graphical display, go to Menu > Measurement chart
08.03.2013 05:05:06
Measurement chart view.
(sample view with optional unit equipment)
Press the “Settings” button.
Temperature
Objecttemperature
---------------------------------------------------------------------
---------------------------------------------------------------------
---------------------------------------------------------------------
Close Settings Home
08.03.2013 05:05:06
Submenu “Settings”.
Select the desired function
and press the operating button.
Close Home
16.1 Setting the sampling rate
To define the sampling rate, go to Menu > Measurement chart > Settings > Sampling rate
08.03.2013 05:05:06
Submenu “Sampling rate”.
Select the desired interval
and press the operating button.
Close Home