Overview of Screens Chore-Tronics® 2 Control
36
MT1843B
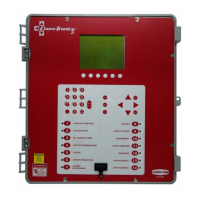
(Alarms Screen) Alarm History Tab
To access the Alarms "Alarm History" Screen, push one of the Tab Keys under
"History". This screen shows the time, date, and type of alarm of the most twenty
recent alarms to occur. The screen also shows how long it took for the alarm to
recover and how long it took the user to notice the alarm.
1. The amount of time (hh:mm) it took for the alarm to recover is shown here. 0:00 means that the alarm
was recovered within the first minute.
2. The amount of time that elapsed (hh:mm) from the time the alarm condition occurred, until the alarm
is NOTICED is shown here.
Screen 9: Curve Settings
The curve settings Screen consists of the Set Temperature Curve, Minimum
Ventilation Curve, and Feeder Window Ramp screens.
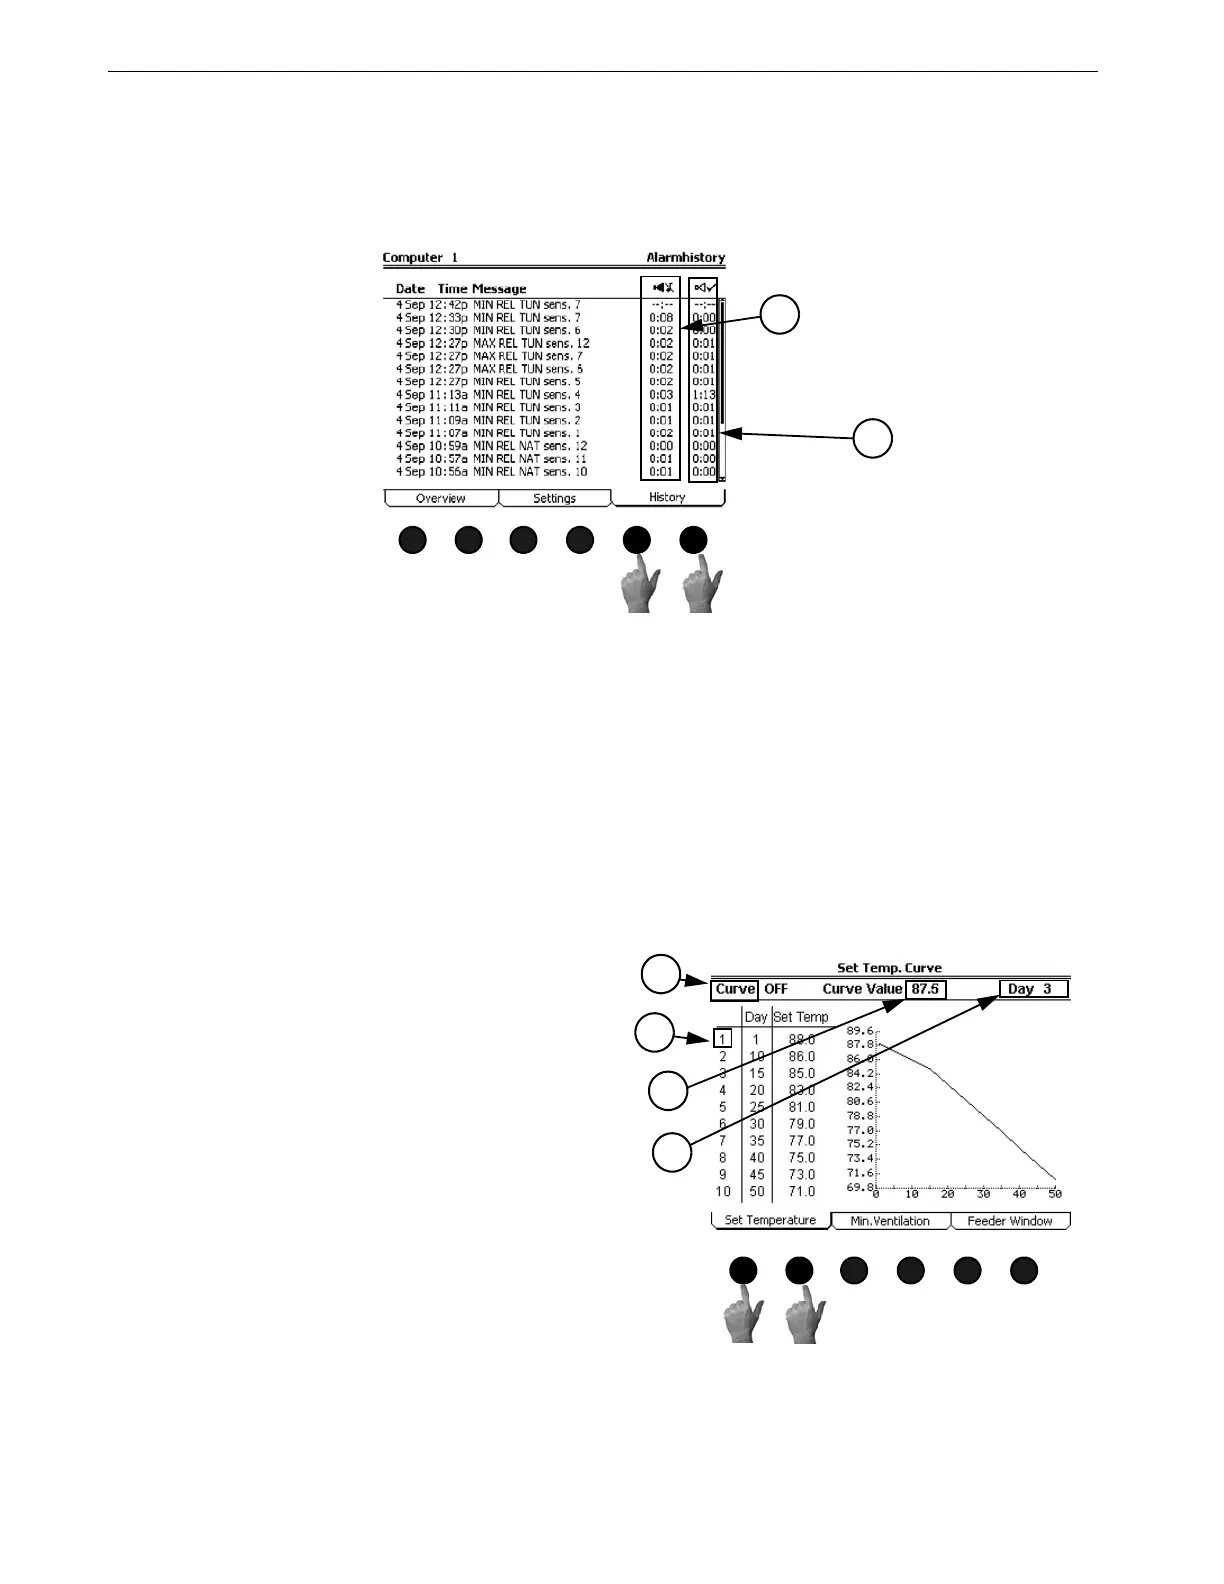
(Curve Settings Screen) Set Temperature Curve Tab
To access the Curve Settings "Set Temperature" Screen, press one of the Tab Keys
under "Set Temperature". There are several terms that need to be defined in order to
understand the Set Temperature Curve Tab Screen.
1. A “curve” is a listing of up to 10 points in time
(bend points) that defines how you want a
parameter to automatically vary as the animals
grow. You make the Control do that by turning
the curve “on”.
2. Curve Value-This indicates the current
value(s) of the specified curve.
3. The Bend Points (BPs)-are points on the curve
that define the curve. The curve values are
adjusted between the Bend Points. The bend
point values are the exact values at midnight
of the day # of each Bend Point. The curve
takes over when you turn the curve “on” and
the day number is equal to or greater than the
day number assigned to BP #1.
4. Day-The intention is that the day # is age of
the animals. Negative days (down to – 7) are
allowed if it is desired to preheat the house, for
example, prior to the arrival of the animals.
The day # of a BP can also be negative, if desired. Changing the day # in any screen that shows the
day number, will change the day # in all the other screens that show the day #.
The graphs on the right side of Set temperature screen shows the progress of the curve. The dashed line
indicated the current day number of the curve.
MT1842-020 10/04
Or
Figure 40. Alarms Screen: History Tab
1
2
MT1842-060 10/04
Figure 41. Curve Settings Screen:
Set Temperature Tab
Or
3
2
1
4