Epsilon EP-P Drive Reference Manual 117
Revision A4 www.controltechniques.com
The following three figures are timing diagrams of a cyclic program with different utilization values (showing the effect) and a
user program initiated to run on a single task.
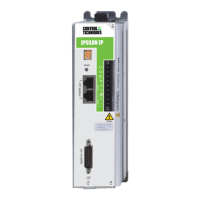
Figure 127: Diagram of User Program and a Cyclic Program
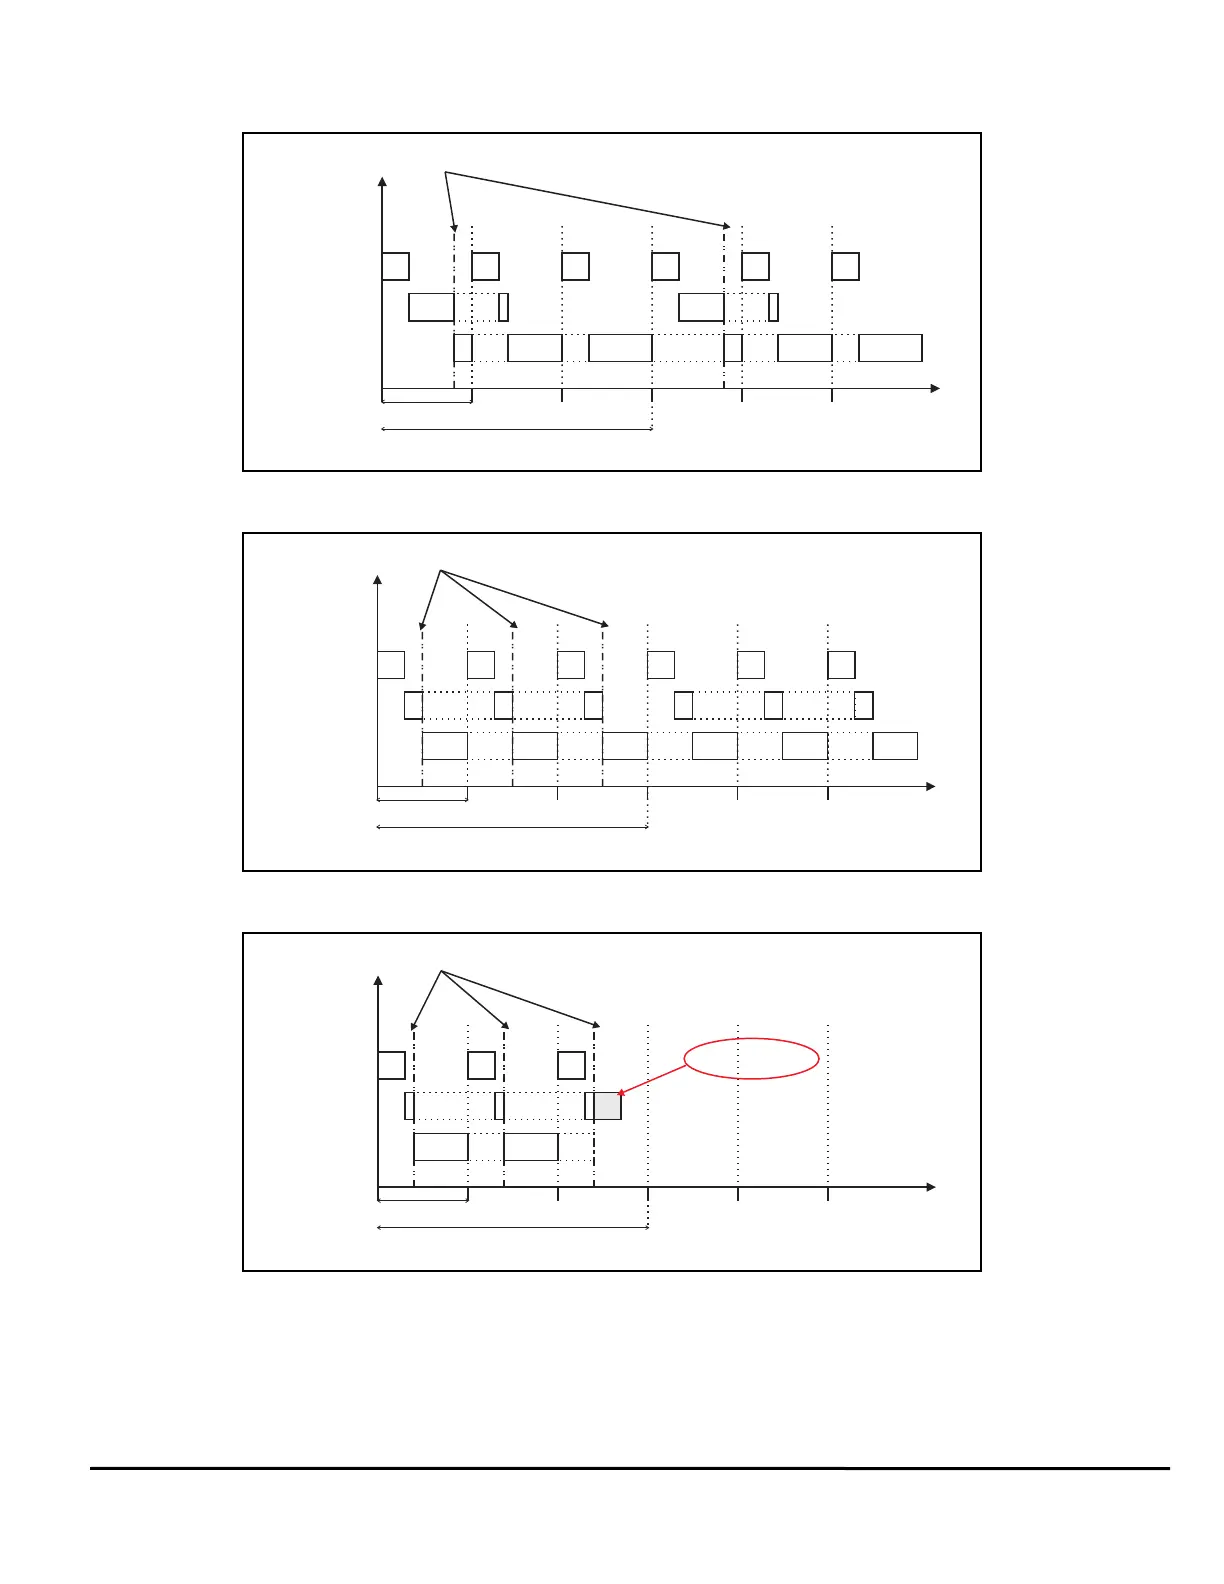
Figure 128: Diagram of User Program and a Cyclic Program
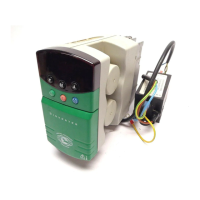
Figure 129: Diagram of User Program and a Cyclic Program
T0
Control Loop
Cyclic Program
Update Rate
User Program
T0
T0
Cyclic Update = 3x Update Rate
T0 T0
T0
Control Loop + Cyclic Prog + User Prog on one Task. Cyclic
Program Utilization set to 80% means cyclic program is suspended
after 80% of update is reached, then resumed next update
Cyclic Program Utilization
set to 80%
T0
Control Loop
Cyclic Program
Update Rate
User Program
T0
T0
Cyclic Update = 3x Update Rate
Same as above except Cyclic Program Utilization is set to 50%
instead of 80%. Note that Cyclic Program takes an extra update rate
cycle to complete
Cyclic Program Utilization
set to 50%
T0 T0
T0
T0
Control Loop
Cyclic Program
Update Rate
User Program
T0
Cyclic Update = 3x Update Rate
Same as above except Cyclic Program Utilization is set to 40%. In
this scenario, Cyclic Program cannot complete within 3 updates and
so Overrun Error occurs in next update. Need less code in Cyclic
Prog, higher Utilization setting, or Larger Cyclic Update Rate setting
Cyclic Program Utilization
set to 40%
Overrun Error