Epsilon EP-P Drive Reference Manual 25
Revision A4 www.controltechniques.com
3.2 Graph View
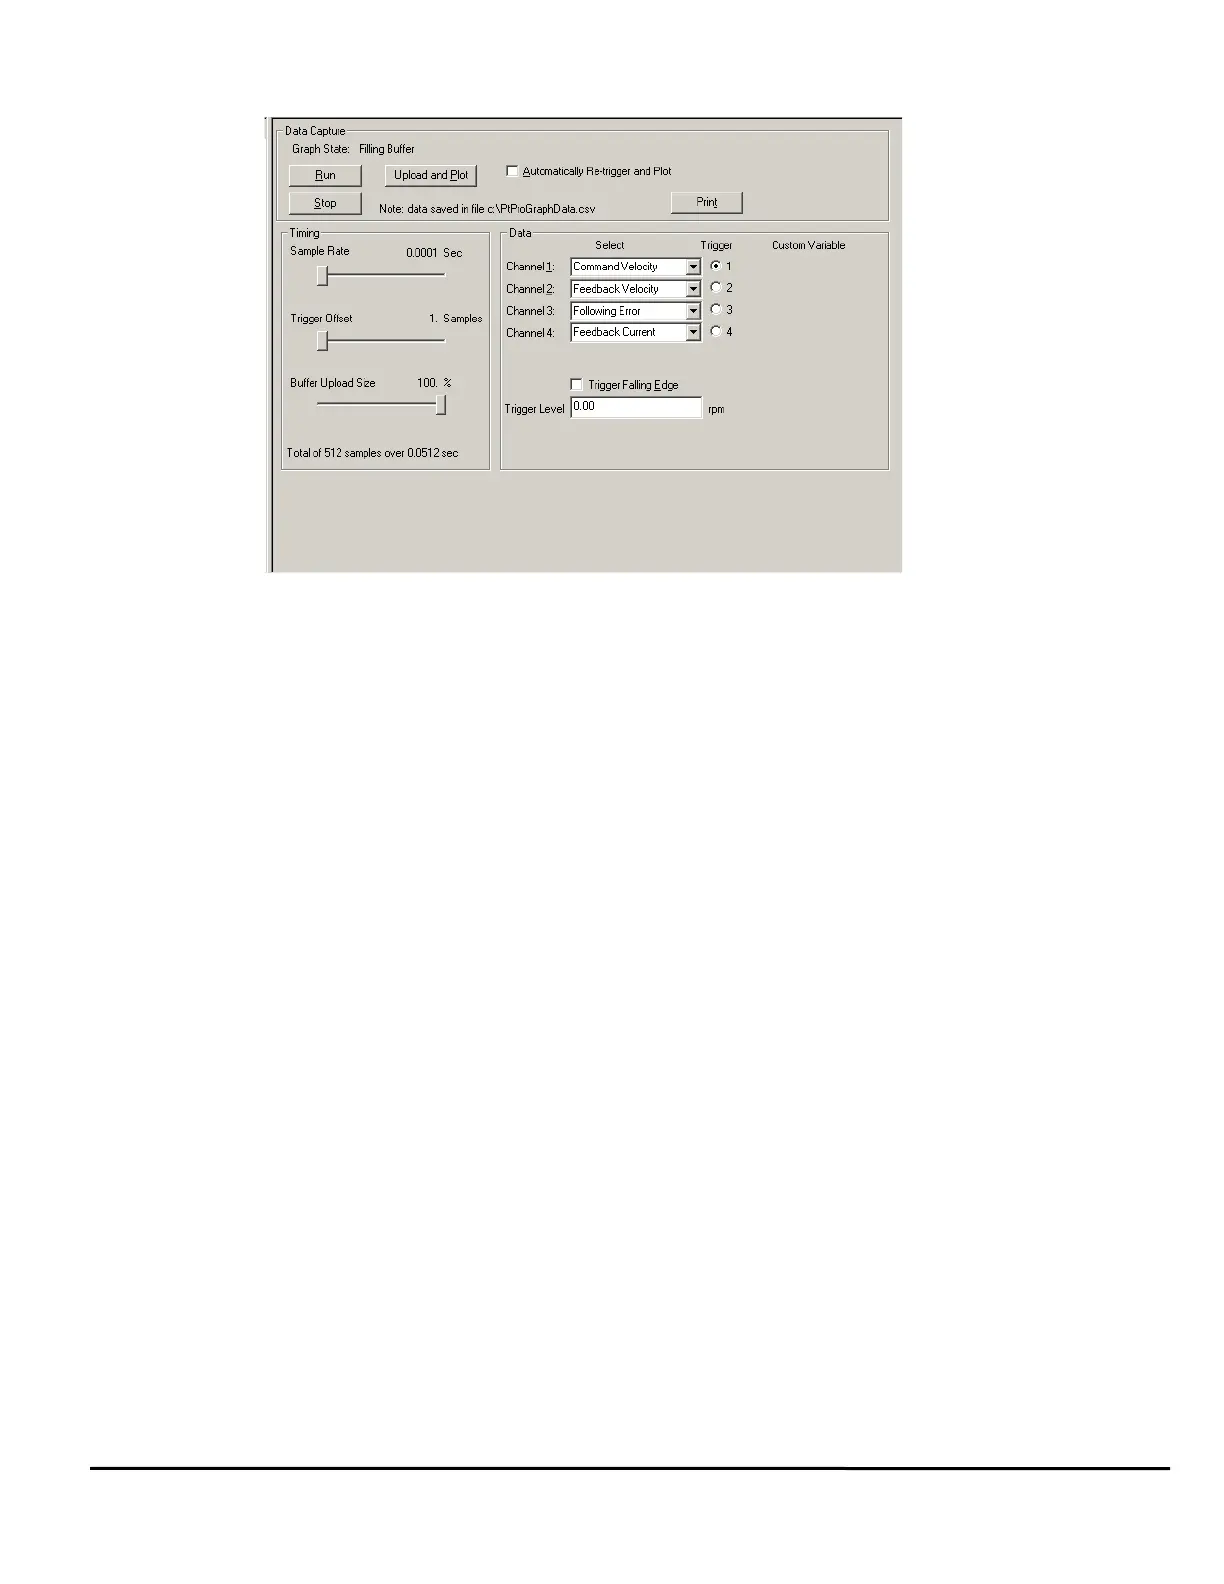
Figure 35: Graph View
3.2.1 Data Capture Group
Graph State
There are three graph state conditions in the following order: Filling Buffer, Filled. Waiting for Trigger, and Filled and Triggered.
Run
The Run button commands the drive to begin a high speed data capture of the parameters as selected in each of the four data
channels. After the Run button is activated the buffer will fill up to the trigger offset while the words “Filling Buffer” appear
indicating this Graph State. Once the trigger offset level is reached the words “Waiting Trigger” will appear next to the Graph
State indicating that graphical monitor is now ready to be triggered based on the trigger level selected.
Upload and Plot
The Upload and Plot button will upload captured data from the drive and display this data in the Graph window. The user
should wait for the Graph State to read “Filled and Triggered” before the data is uploaded.
Stop
The Stop button stops the data capture with the data captured at that point. You can upload and plot that data. If the buffer is
only partially filled you will get a combination of good and bad data. Stop works well as a manual trigger, in place of the
configured trigger.
Automatically Re-trigger and Plot Check Box
Select the check box and the Automatically Re-trigger and Plot tells PowerTools Pro to monitor the graph state for the
triggered condition. When this condition occurs, it automatically initiates the UploadPlot command, waits for a brief time then
initiates the Run button to repeat the cycle. Initially the user must press the Run button to start the auto cycle.
This mechanism is only active when the graph view is displayed, If the user enters a different PowerTools view the auto update
will stop and it will restart when returning to the Graph view.
Print
The Print button is used to print the graph in the Graph window.
3.2.2 Timing Group
The sliders can be moved in several different ways.
1. With the mouse pointer over the slider, left click and hold while dragging the slider back or forth to the desire setting.
2. With the mouse pointer over the slider, left click on the slider and then the arrow keys on the PC keyboard can be used to
move the slider in fine increments. The Page Up and Page Down keys move the slider in course increments. The Home key
will move the slider all the way to the left and the End key will all the way to the right.
Sample Rate
The Sample Rate slider gives the user control of time spacing for the captured date. To give the user a better idea of what this
number means, the total number of samples and total capture time is displayed on the bottom of the “Timing” group box.
Trigger Offset
The Trigger Offset slider corresponds to the number of samples that will be included on the graph display and data capture
prior to the actual trigger. If the Trigger offset slider is completely to the left (min samples), the data capture and graphing will