376 Viewing Statistics
•
% Interface Utilization
— Network interface utilization percentage based on the duplex mode of the
interface. The range of this reading is from 0 to 200%. The maximum reading of 200% for a full duplex
connection indicates that 100% of bandwidth of incoming and outgoing connections is used by the
traffic travelling through the interface. The maximum reading for a half duplex connection is 100%.
•
% Unicast Received
— Percentage of Unicast packets received on the interface.
•
% Non Unicast Packets Received
— Percentage of non-Unicast packets received on the interface.
•
% Error Packets Received
— Number of packets with errors received on the interface.
•
Global System LAG
—
Current LAG/trunk performance.
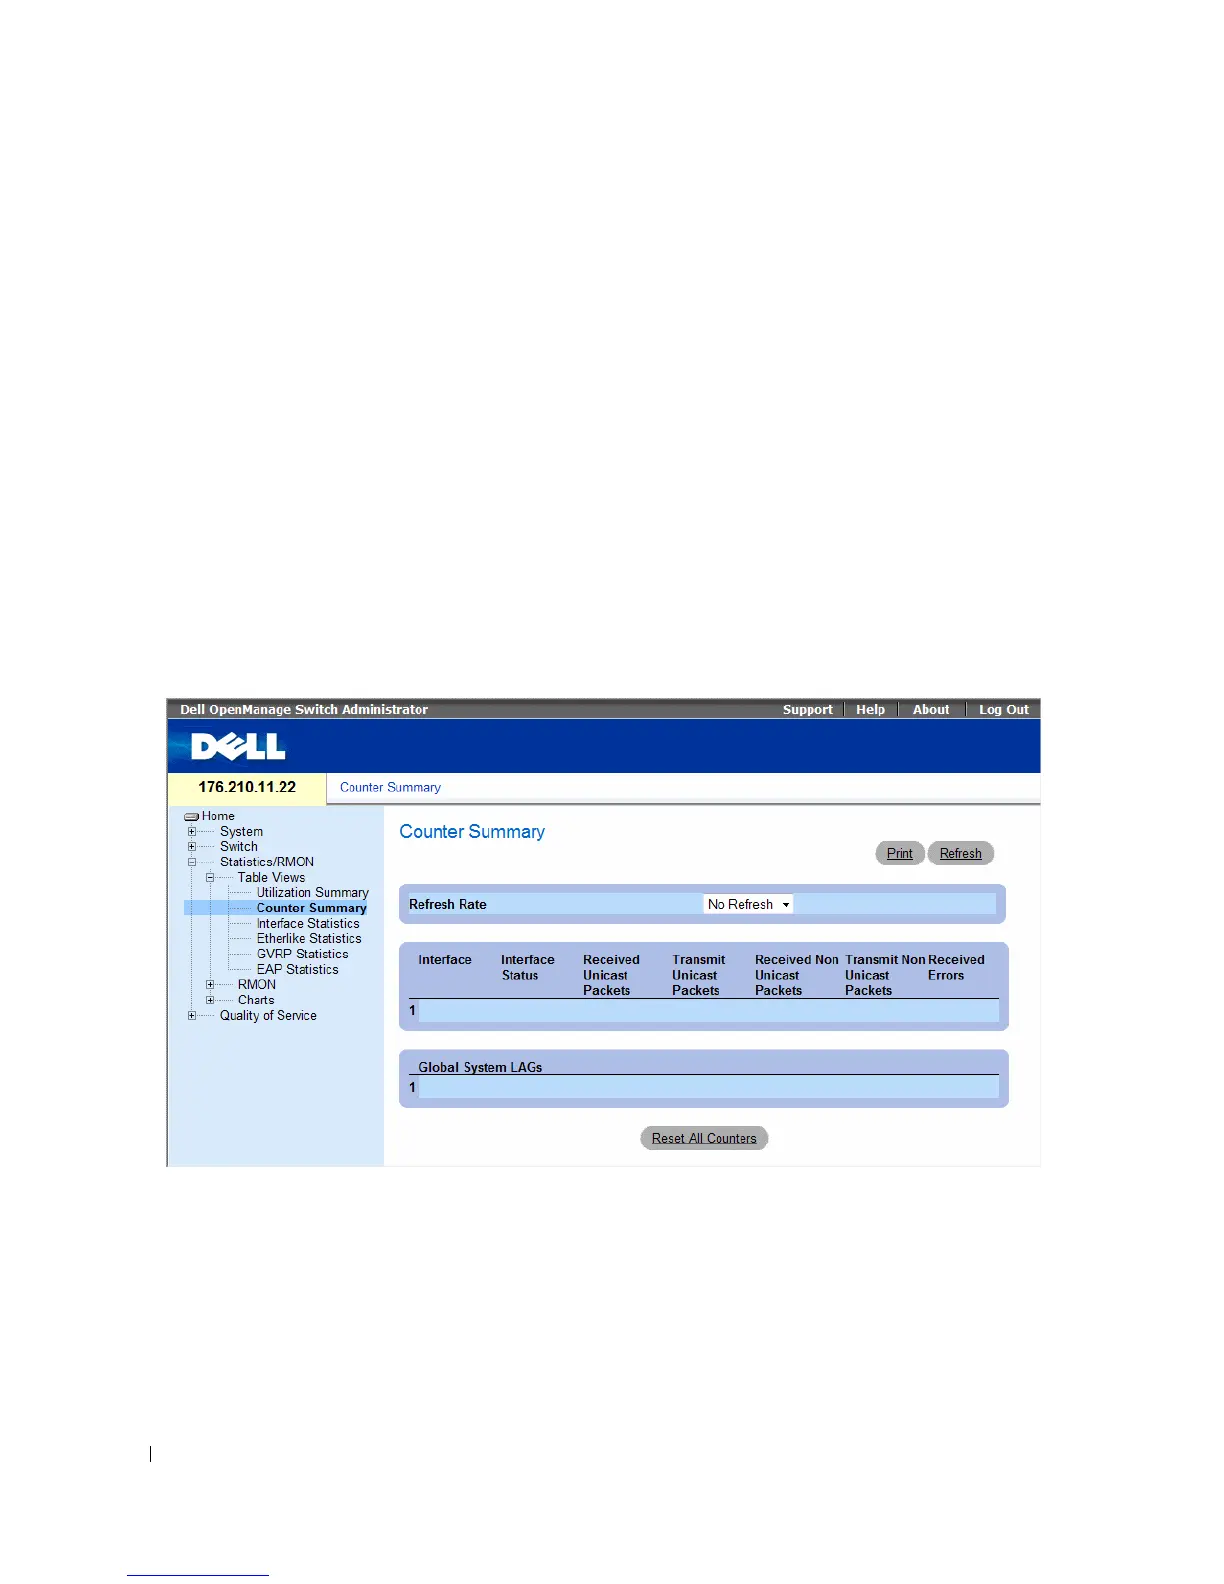
Viewing Counter Summary
The Counter Summary page contains statistics for port utilization in numeric sums as opposed to
percentages. To open the Counter Summary page, click Statistics/RMON→ Table Views→ Counter
Summary in the tree view.
Figure 8-2. Counter Summary
•
Refresh Rate
— The amount of time that passes before the interface statistics are refreshed.
•
Interface
— The interface number.
•
Interface Status
— The interface status.
•
Received Unicast Packets
— Number of received Unicast packets on the interface.
•
Received Non Unicast Packets
— Number of received non-Unicast packets on the interface.
•
Transmit Unicast Packets
— Number of transmitted Unicast packets from the interface.
 Loading...