4 • Display device screens | Dexcom ONE+ User Guide
21
Receiver
The receiver home screen shows your current sensor reading and trend arrow. In the receiver, go to Menu > Help for more
information.
7.2
mmol/L
10:30 AM 50%
1
2
3
4
5
6
7
1. Number: This is your most recent sensor reading.
2. Trend arrow: Shows where your glucose is heading based on the last
few readings.
3. Trend graph: The bigger dot on the right is the most recent sensor
reading. The smaller dots show past readings.
4.
3 Hours : Change the number of hours shown on the trend
graph using the arrow buttons.
5. Target range (shaded rectangle inside graph): 3.9–10.0mmol/L is
the international consensus for recommended target range.
6. High alert, yellow line: You get your High alert when your glucose is
at or above the yellow line. Change level in Menu > Settings > Alerts
> High.
7. Low alert, red line: You get your Low alert when your glucose is at or
below the red line. Change level in Menu > Settings > Alerts > Low.
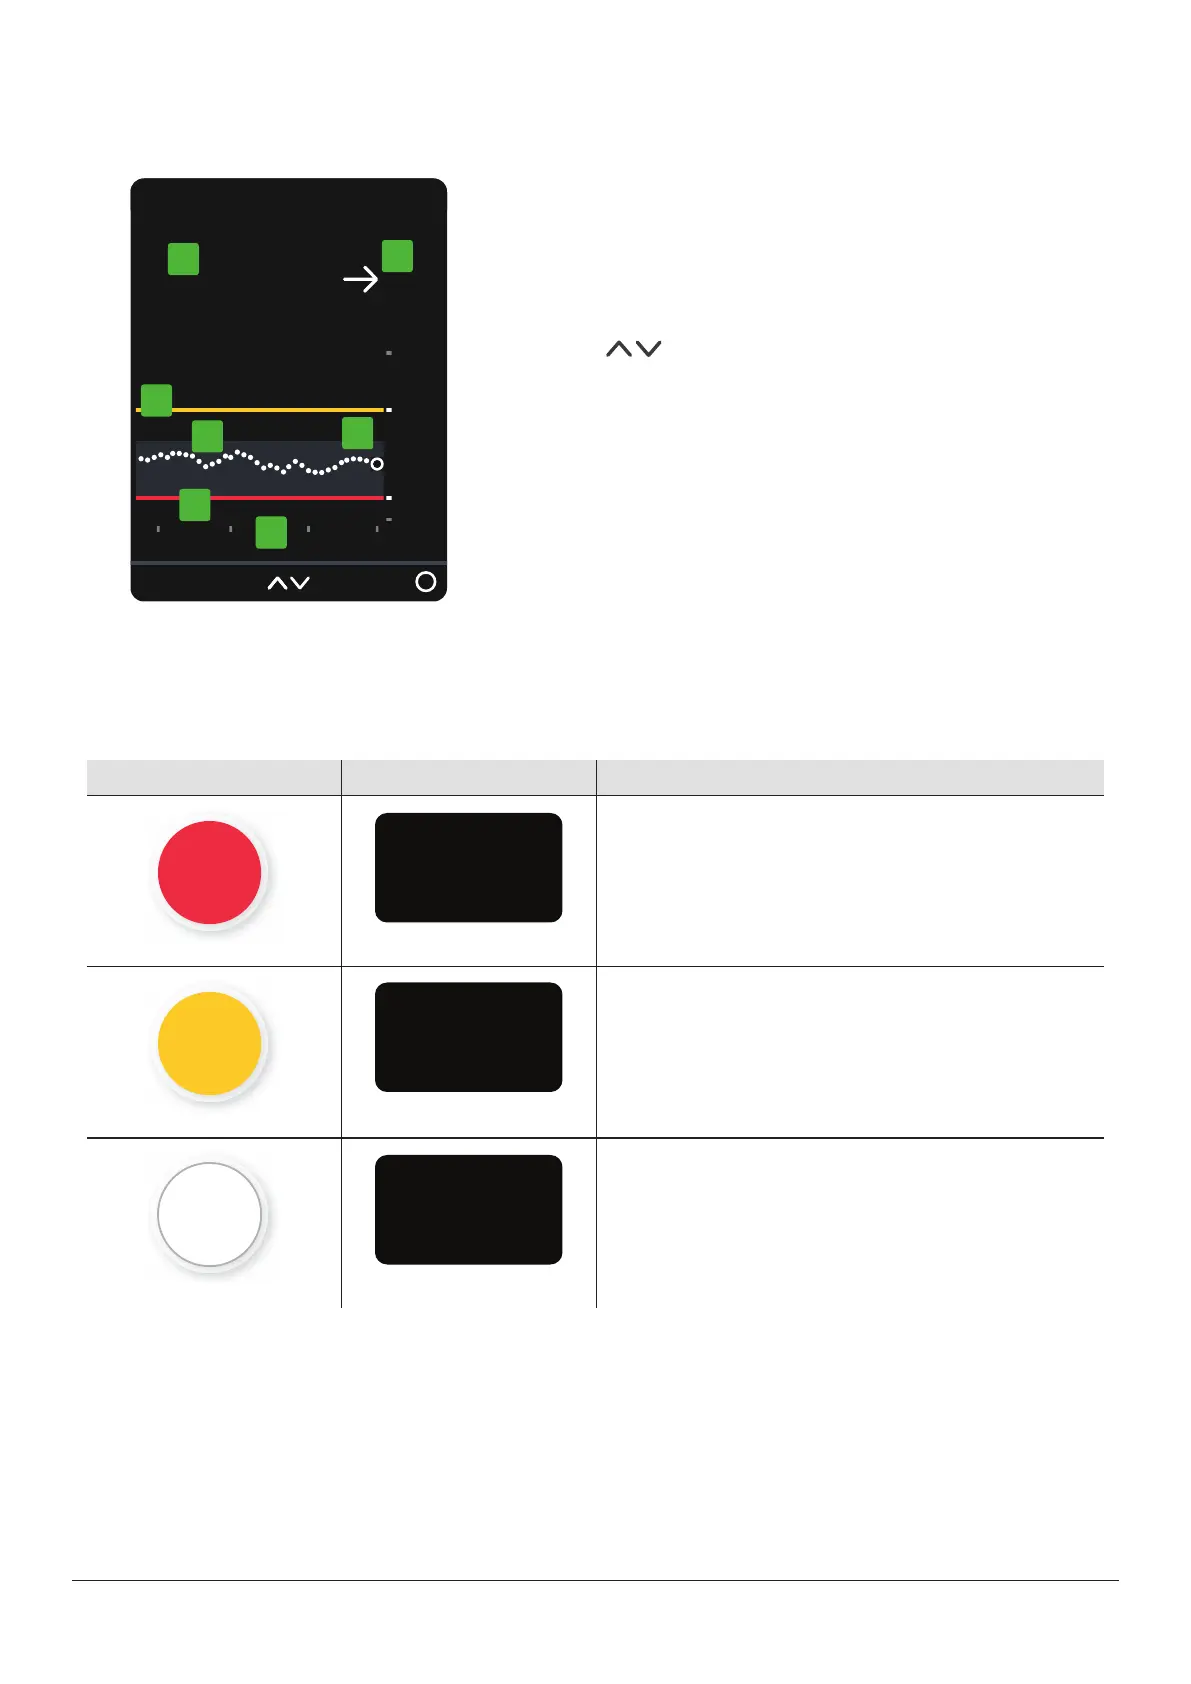
Sensor reading and trend arrow
Where your glucose is now
A number and color tell you where your glucose is now.
App Receiver What it means
Red: Low
Yellow: High
White: Between your high and low alert levels