4 • Display device screens | Dexcom ONE+ User Guide
27
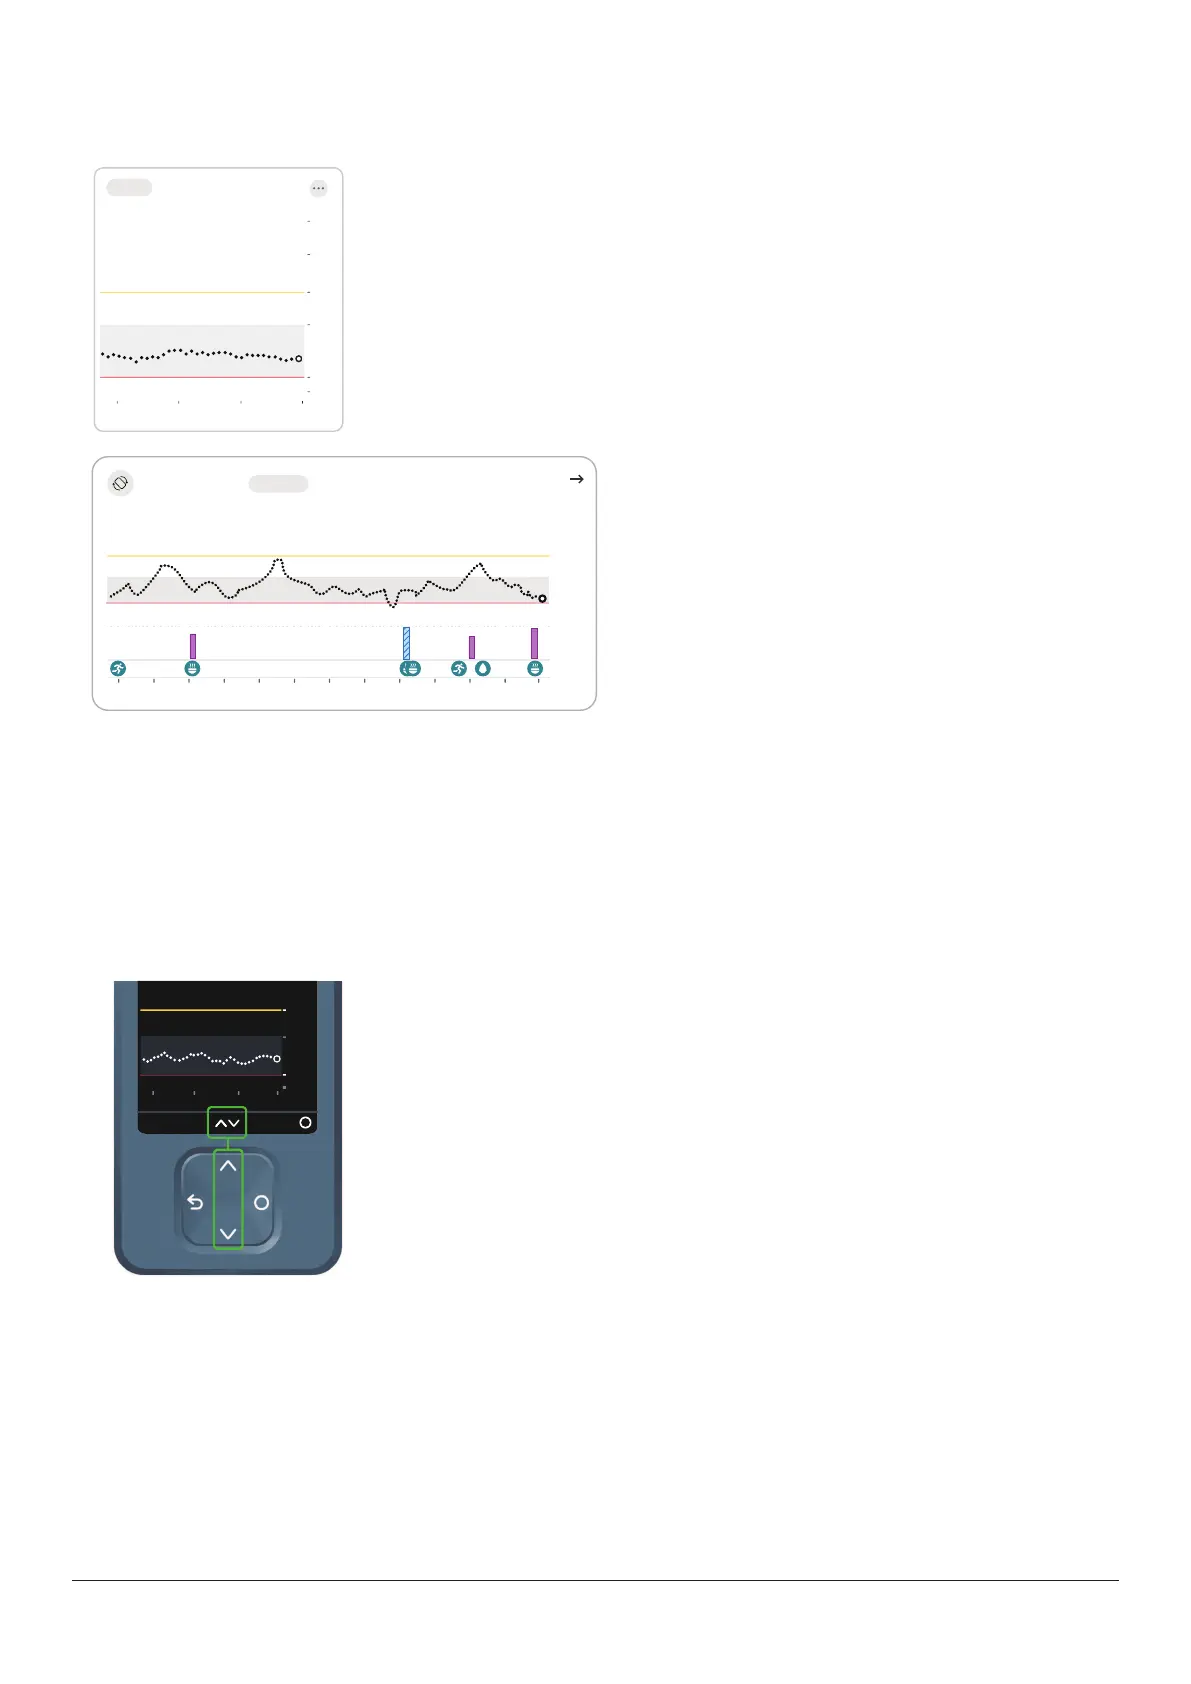
Trend graph history
App
Now432
2
3.9
14.0
22
3 Hours 6 12 24
18
10
Tap the numbers above the trend graph to see your trend graph over 3, 6, 12, and
24hours.
- 2
- 3.9
- 14.0
- 22
4.1
mmol/L
Now
3 6 12 24 Hours
2121086421210864
To see your events history in your trend graph, turn your
phone to landscape.
Tap the numbers at the top-left of the screen to switch
between 3, 6, 12, and 24 hours of information.
Your current sensor reading and trend arrow are in the upper right corner.
If you added an event during that timeframe, such as a meal, the event appears at the bottom of the graph. Insulin doses you
entered are in a separate row. This lets you see how the events you entered affected your glucose level.
Touch and hold the graph to see your glucose level at the time under your finger.
Touch, hold, then drag over the graph to see your event and insulin details for that time.
Tap the icon in the upper left corner to return to portrait mode.
Receiver
On the home screen, use the up and down arrows to switch between the 1, 3, 6, 12,
and 24-hour views.