Introduction
Hardware Installation and Maintenance Manual 1
–7
Note that contamination of the mirrors results solely in lower overall signal.
However, by tuning the laser off-resonance as well as on-resonance and
normalizing the data, the technique self calibrates every scan resulting in
measurements that are unaffected by mirror contamination.
Wavelength Modulation Spectroscopy (WMS) Signal Detection
SpectraSensors takes the fundamental absorption spectroscopy concept a step
further by using a sophisticated signal detection technique called wavelength
modulation spectroscopy (WMS). When employing WMS, the laser drive
current is modulated with a kHz sine wave as the laser is rapidly tuned. A lock-
in amplifier is then used to detect the harmonic component of the signal that
is at twice the modulation frequency (2f), as shown in Figure 1–4. This phase-
sensitive detection enables the filtering of low-frequency noise caused by
temperature and/or pressure fluctuations, low-frequency noise in the laser
beam or thermal noise in the detector.
With the resulting low-noise signal and use of fast post-processing algorithms,
reliable parts per million (ppm) or parts per billion (ppb) detection levels are
possible (depending on target and background species) at real-time response
rates (on the order of 1 second).
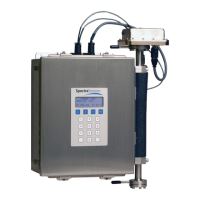
All SpectraSensors TDLAS gas analyzers employ the same design and hardware
platform. Measuring different trace gases in various mixed hydrocarbon
background streams is accomplished by selecting a laser wavelength that
provides the least amount of sensitivity to background stream variations.
Normalized
2f Signal
Wavelength [a.u.]
Signal [a.u.]
Figure 1–4 Typical normalized 2f signal; species
concentration is proportional to the peak height
 Loading...