52
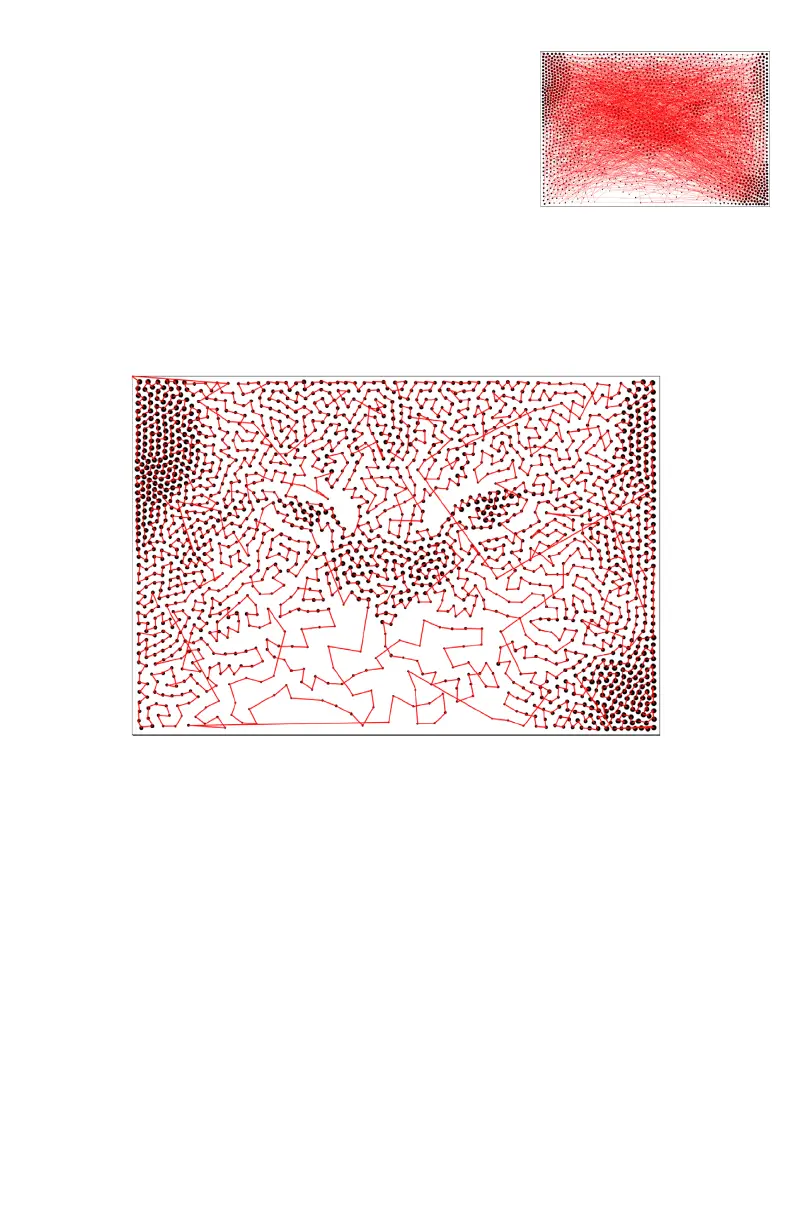
The time report from this plot reads as follows:
Estimated print time: 37:14 (minutes, seconds)
Length of path to draw: 16.26 m.
Pen-up travel distance: 253.35 m.
Total movement distance: 269.61 m.
As you can see by the numbers and the pen-up travel (shown in red), this plot is
dominated by pen-up travel. Only about 6% of the travel is with the pen down.
If we now enable plot optimization, selecting “Full” reordering, we get the follow-
ing, much more pleasing result:
With optimization enabled, the statistics are as follows:
Estimated print time: 19:03 (minutes, seconds)
Length of path to draw: 16.26 m.
Pen-up travel distance: 10.96 m.
Total movement distance: 27.22 m.
Thus, with the option enabled, this particular plot now takes about half the time:
19 minutes instead of 37.
Aside: While this is a contrived example, some real-world documents can ex-
hibit this level of initial disorder, for example when you start with scanned
and traced artwork, or documents generated programatically.

 Loading...