Version date: 04 April 2016
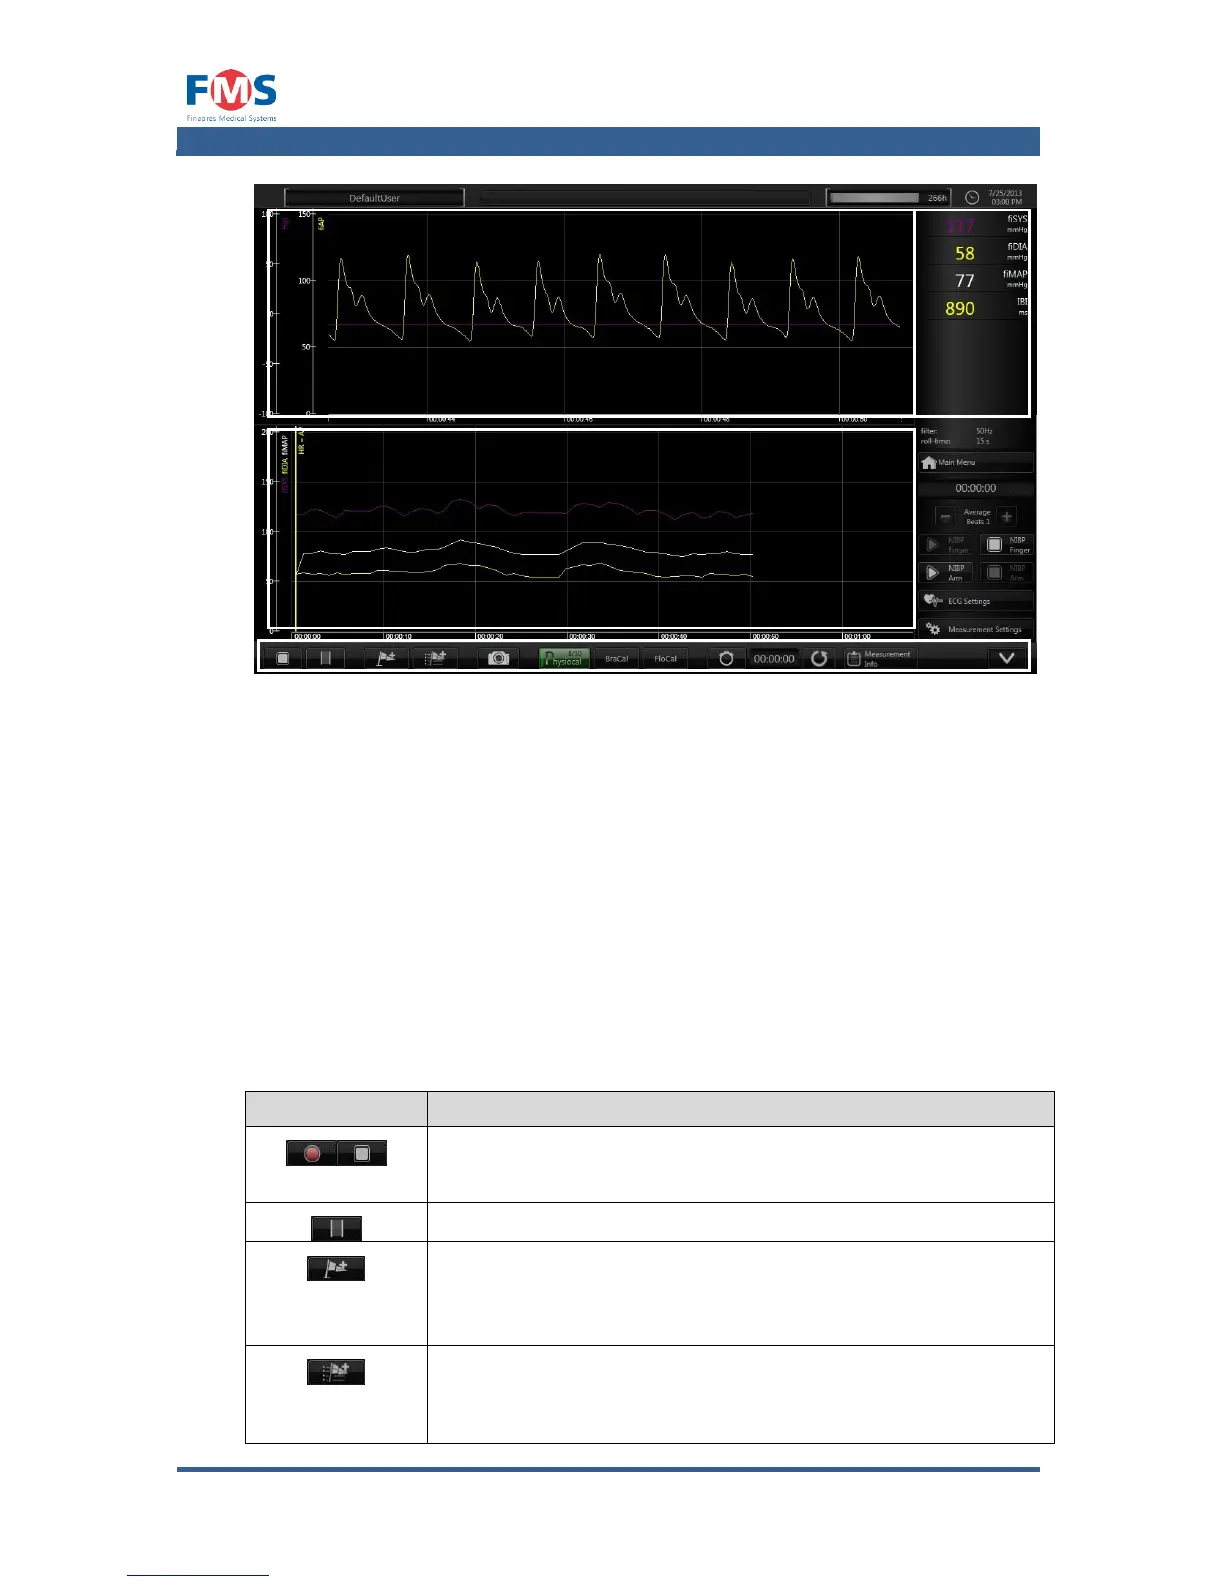
Figure A1-8: The “MEASUREMENT” screen
The “MEASUREMENT” screen is divided into four parts (see Figure A1-8):
1. Trend Graphs
In this area the trend graphs defined in the “MEASUREMENTS SETTINGS”
screen (refer to A1.4.3) are shown.
2. Wave form graphs
In this area the wave form graphs defined in the “MEASUREMENTS
SETTINGS” screen (refer to A1.4.3) are shown.
3. Numeric signals
In this area the numeric values of the signals defined in the
“MEASUREMENTSSETTINGS” screen (refer to A1.4.3) are shown.
4. Controls
The controls of the “MEASUREMENT” screen have the following functionality:
Toggle button to start and stop the measurement.
Highlights a period during a measurement.
Immediately adds a standard marker to the graph when to
indicate a sudden interesting event. In review mode the
marker can be renamed if desirable.
Opens a pop-up screen that shows the predefined markers.
After selecting a marker or entering a new name for the
marker it can be added to the graph by clicking the OK button.