RSDetection
User’s Manual
Copyright © 2016 General Electric Company. All Rights Reserved S131-200-UM Rev A
Page 47
5.3.4 Plots Tab
The Plots tab displays the system measurements on a graph in real time. The following
options display across the top of the screen:
Clear plots – Erases data on the graph.
Enable/Disable Logging - Enabling logging will write the highlighted
measurements into a .csv text file. As each new value is received from the unit,
a new line in the file will be written. The files will be written to the folder
specified in the LiveLoggingFolder property in the ApplicationConfiguration
described in the Main Menu Functions section of the manual. To highlight a
measurement, the check box next to the measurement must be checked and
the name of the measurement clicked. The name of the file will be the
measurement name followed by the date and time. For example, a log file
name for DaqTemperature may be
“DaqTemperature_05_15_2013_12_52_38.csv”.
Scale Y-Axis – Adjust the y-axis on the graph for different measurement
increments by typing the minimum and maximum measurements.
Scale X-Axis – Adjust the x-axis on the graph for the total time visible on the
graphic by typing the number of minutes to see.
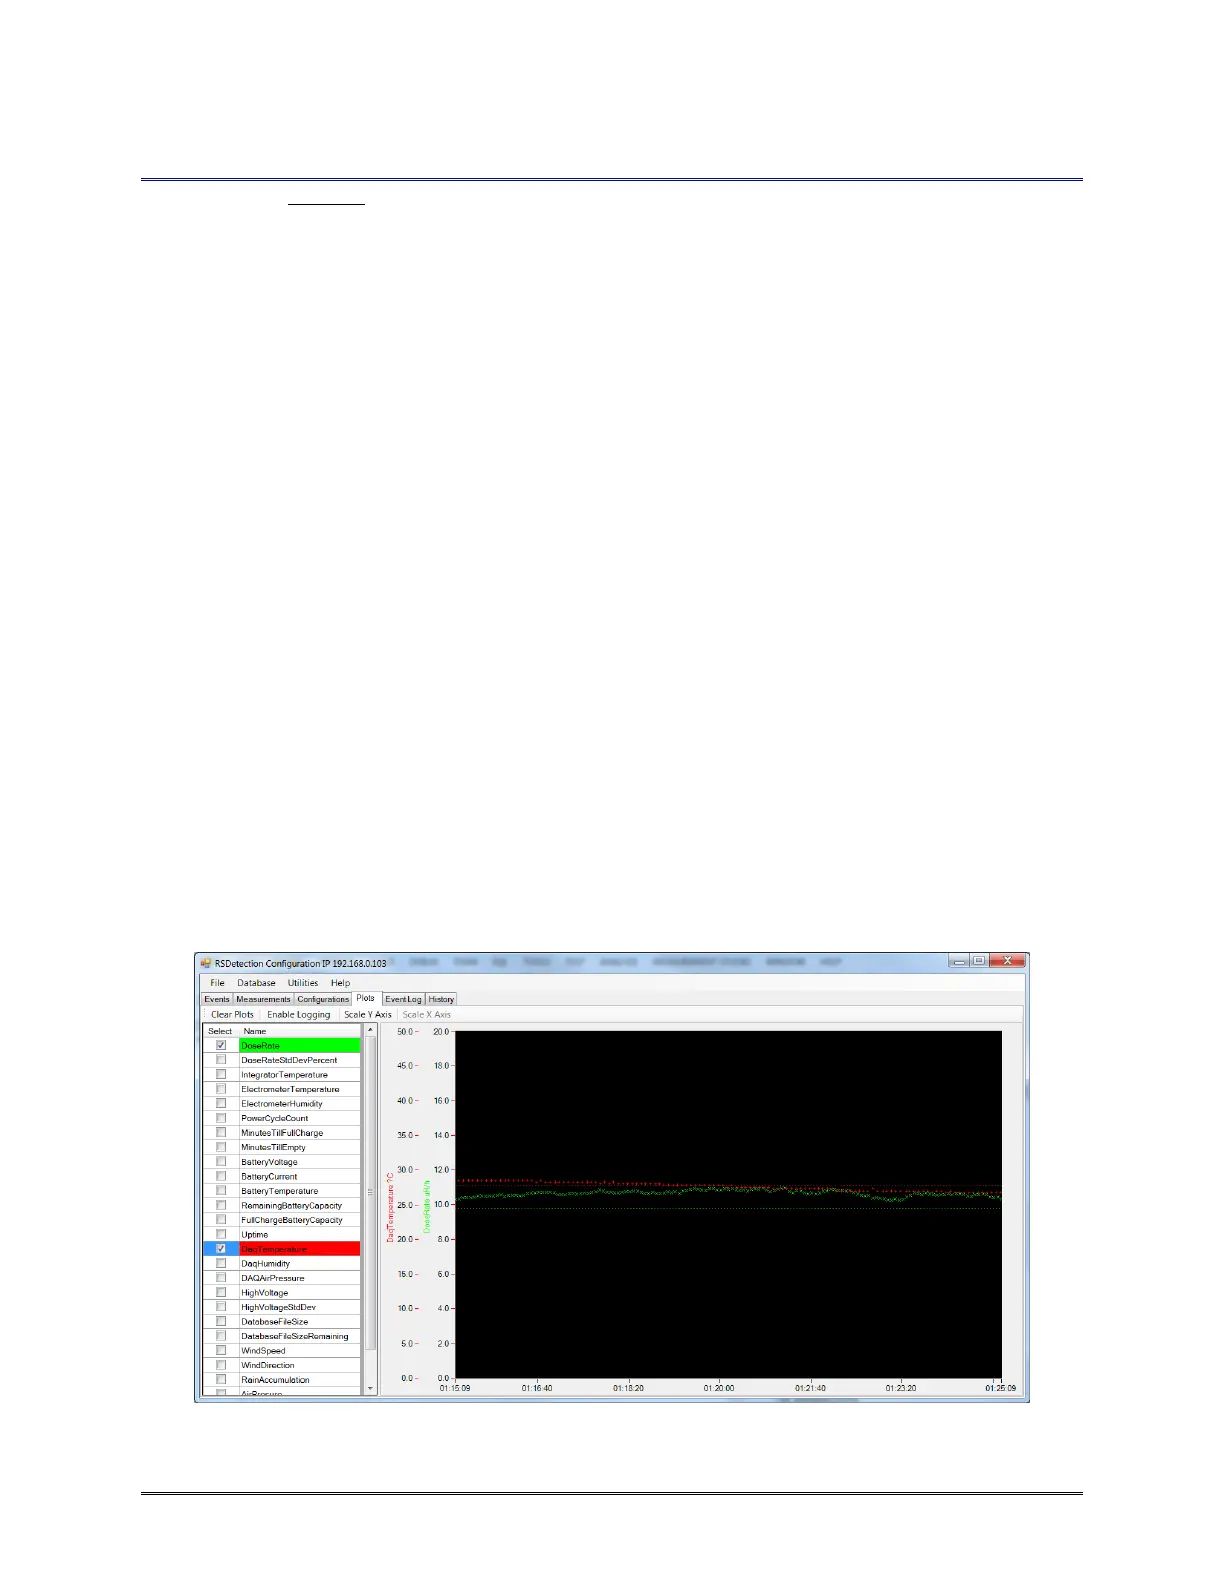
To select the measurement to view, click the Select check box to the left of the
measurement. The name of the measurement is highlighted in a color that corresponds to
the colors on the graph. The x-axis displays the time the reading was taken. The y-axis
displays the units of measure in the corresponding color. The data measurements are
shown on the graph in the corresponding colors.
If you select a new measurement to view, a vertical line appears on the graph at the time
you started the reading. Up to 4 measurements can be selected.
Figure 27 Plots Tab
 Loading...