Data Logging 5-15
August 2008
The Graph Option Use the Graph option to view the log data in graphical format:
1. In the Log Manager window (see Figure 5-2 on page 5-2), use the
[T] and [S] arrow keys to highlight the log you wish to view.
2. At the Log Manager window, press [MENU] and then [ENTER].
3. Press the [X] key twice to highlight the View menu and press
[ENTER].
4. In the View menu, scroll to the Graph option and press [ENTER].
This opens the Select Measurement window (see Figure 5-7 on
page 5-6), which lists the log measurement parameters.
5. If the log contains more than one measurement, scroll through the
list to highlight the parameter you wish to graph. Then, press
[F3]
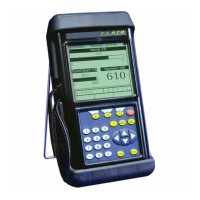
(View) and a window similar to Figure 5-12 below appears.
Figure 5-12: The Log Graph Window
The following choices are now available:
• Press [F1] (Scale) if you wish to change the y-axis limits.
• Press [F2] (Time) if you wish to change the x-axis limits.
• Press [F3] (Exit) when you have finished viewing the graph.
AAA.LOG (Velocity, ft/s)
297
Time Exit
2001/03/01
2001/03/01
13:23:41 PM
13:53:41 PM
289
Scale
 Loading...
