4. Managing HART Devices using FDC Application Software
4.6. Online configuration
Revision 3 MC Toolkit (MCT404) User Manual 51
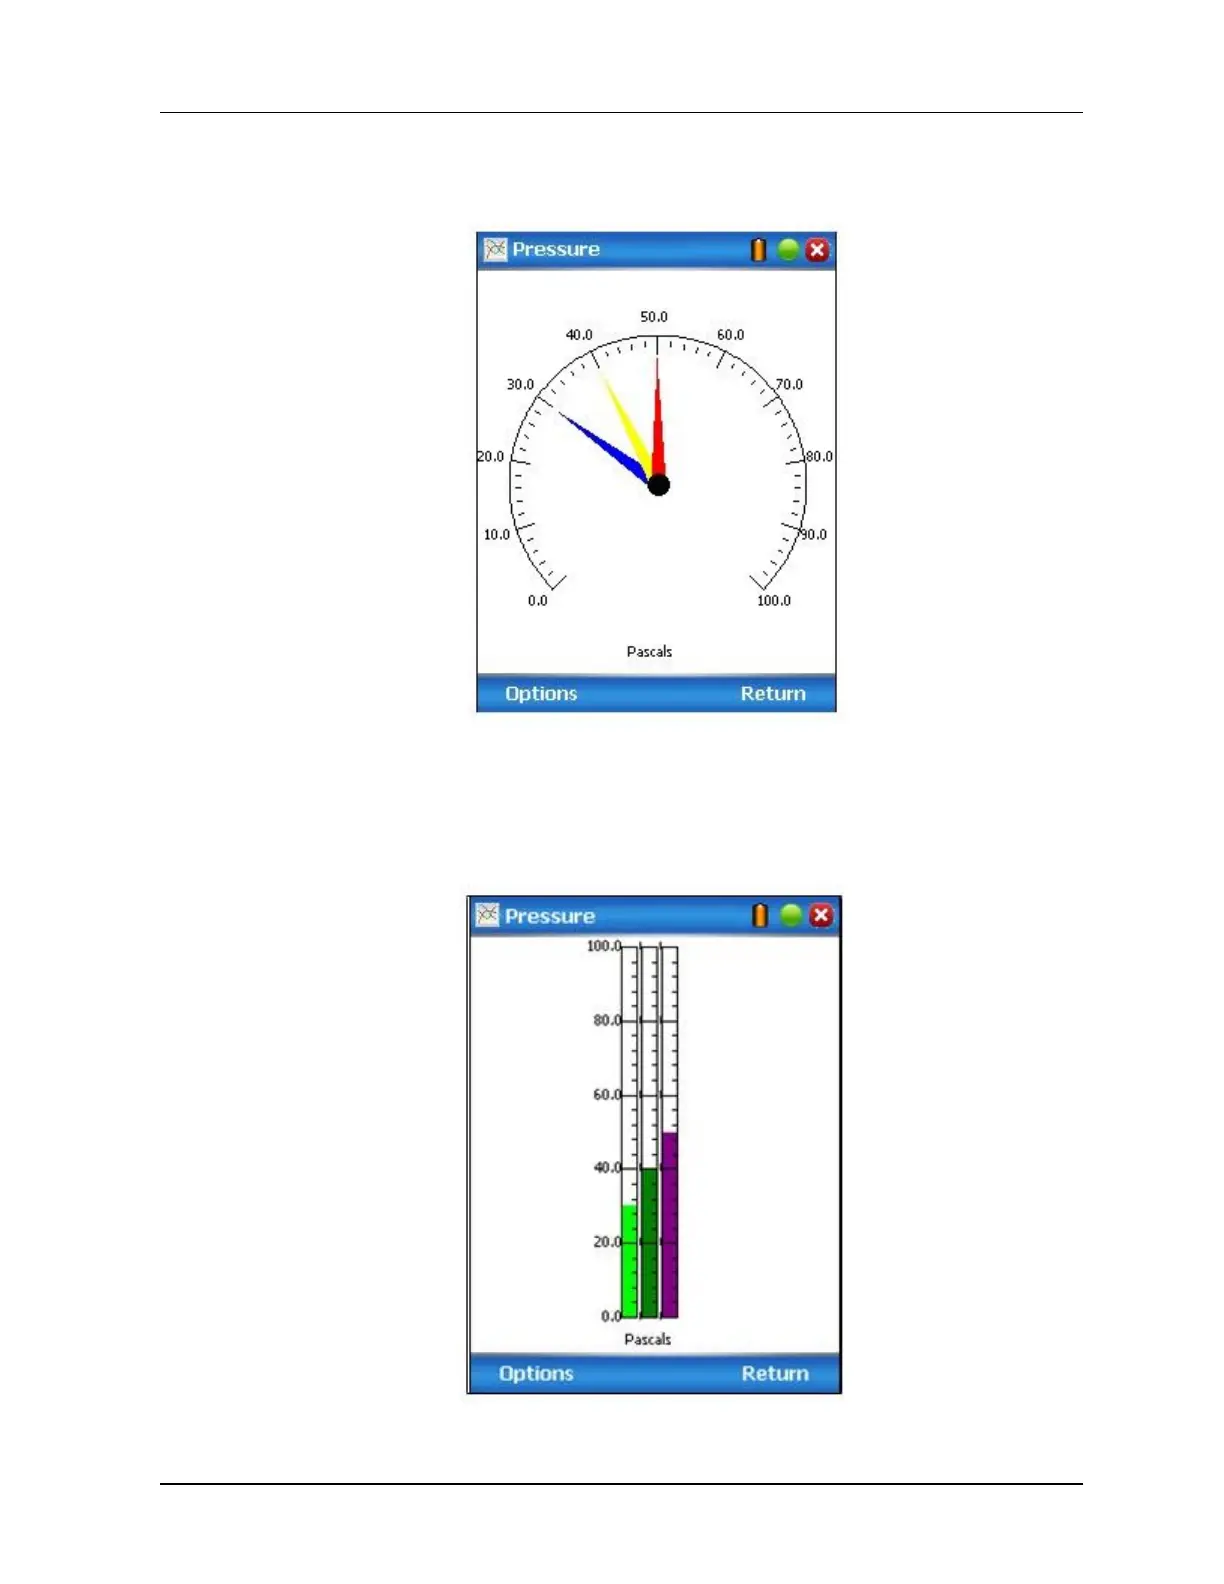
Gauge: A gauge chart formats the device data into a view similar to circular, dial-type analog meter.
The indicator is a pointer that rotates as the current value varies with time.
Bar Charts: A bar chart displays the device data in bars varying with time. A bar displays values
from bottom to top with its origin (minimum value) at the bottom of the chart Alternately, a bar may
also displays values horizontally from left to right with its origin (minimum value) at the left of the
chart
 Loading...