9-6 Return to Section Topics 6482-901-01 Rev. A / August 2012
Section 9: Measurement Concepts Model 6482 Dual-Channel Picoammeter / Voltage Source Reference Manual
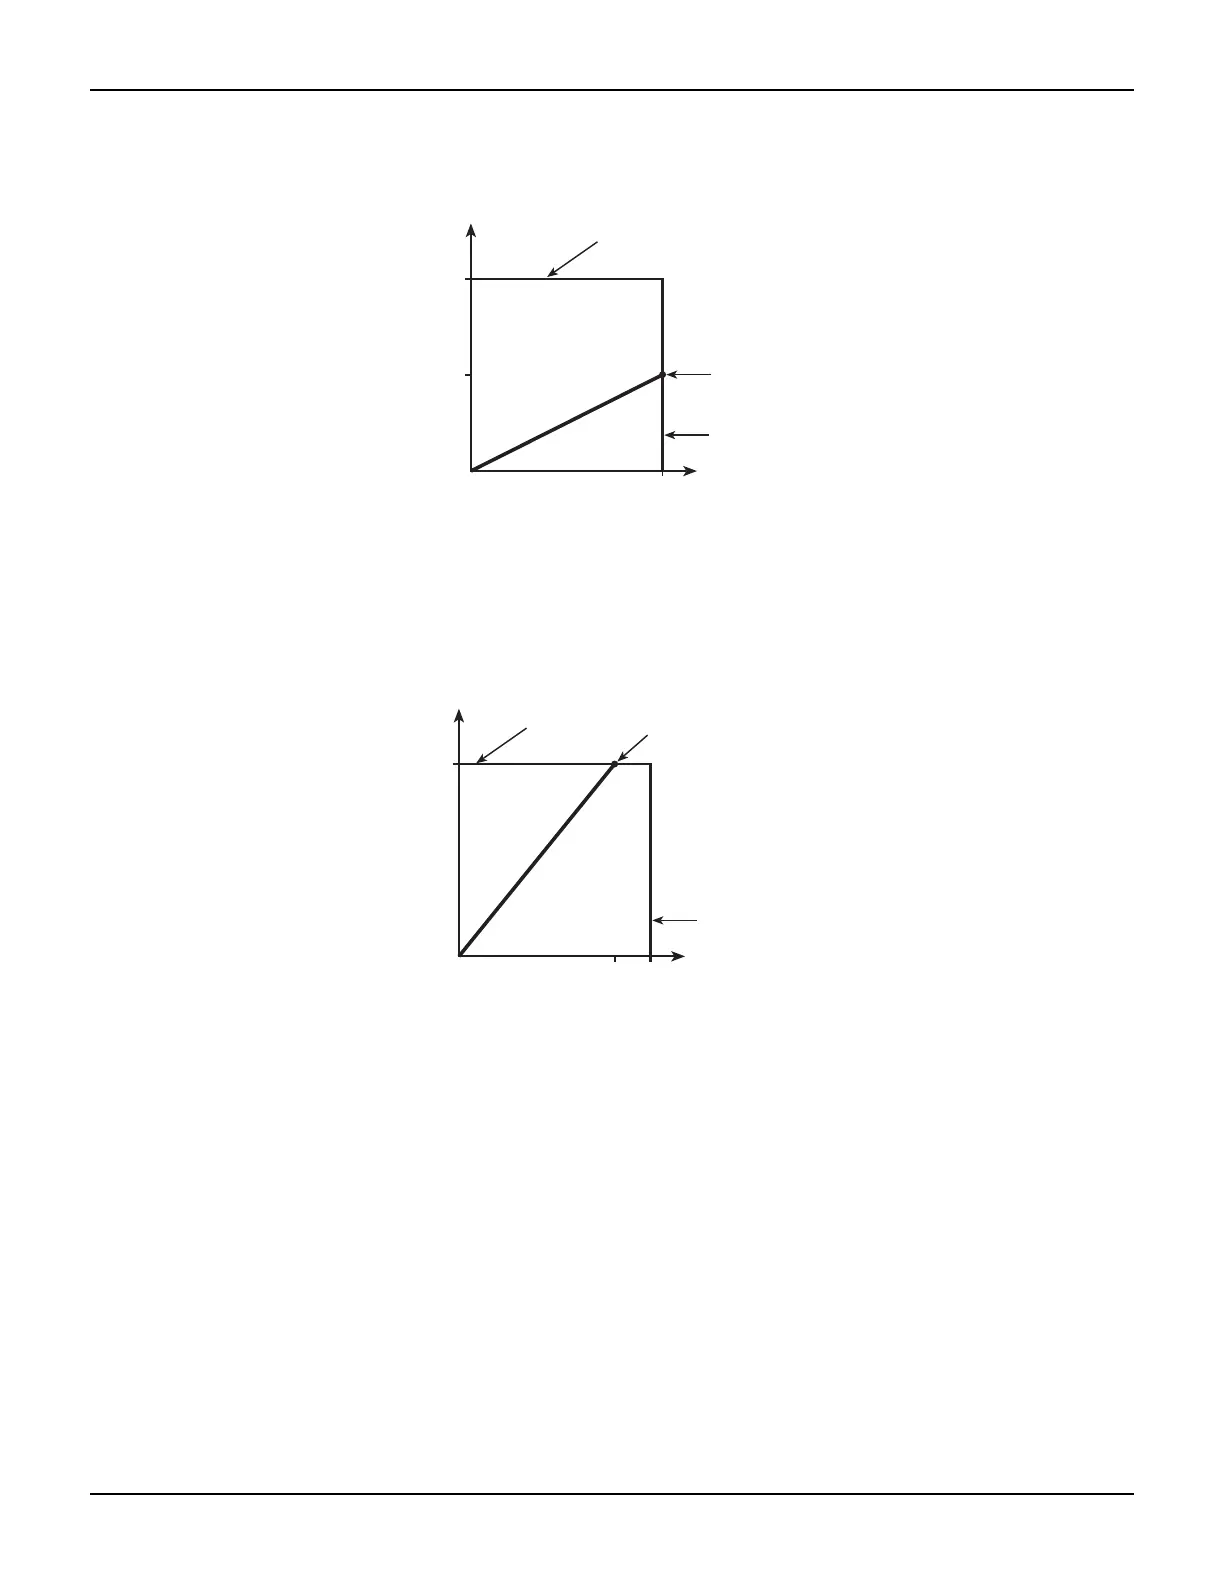
Figure 9-5
Loading effects
Data flow
Data flow for front-panel operation is summarized by the block diagrams provided in Figure 9-6,
and Figure 9-7 shows data flow through the various CALC blocks. Note that if REL is enabled, the
result of the rel operation is sent to the other blocks.
NOTE See Appendix B for remote operation data flow information that describes the CALC
blocks in detail.
A. Normal bias source operation
B. Bias source in compliance
V
S
Operating
point
Voltage source
load line
20 mA
10 V
= 8 V
8 V
4
00 Ω DUT lo
ad
line (R)
Output
current (I)
Output voltage (V)
Operating
point
Voltage source
load line
Output voltage (V)
Output
current (I)
10 mA
20 mA
10 V
1
k
Ω DUT load line (R)
I = V / R
= 10 mA
= (20 mA) (400 Ω)
= I
M
• R
= 10 V/1 kΩ
Current limit
load line
Current limit
load line