Voltage, Current, and Power Measurements
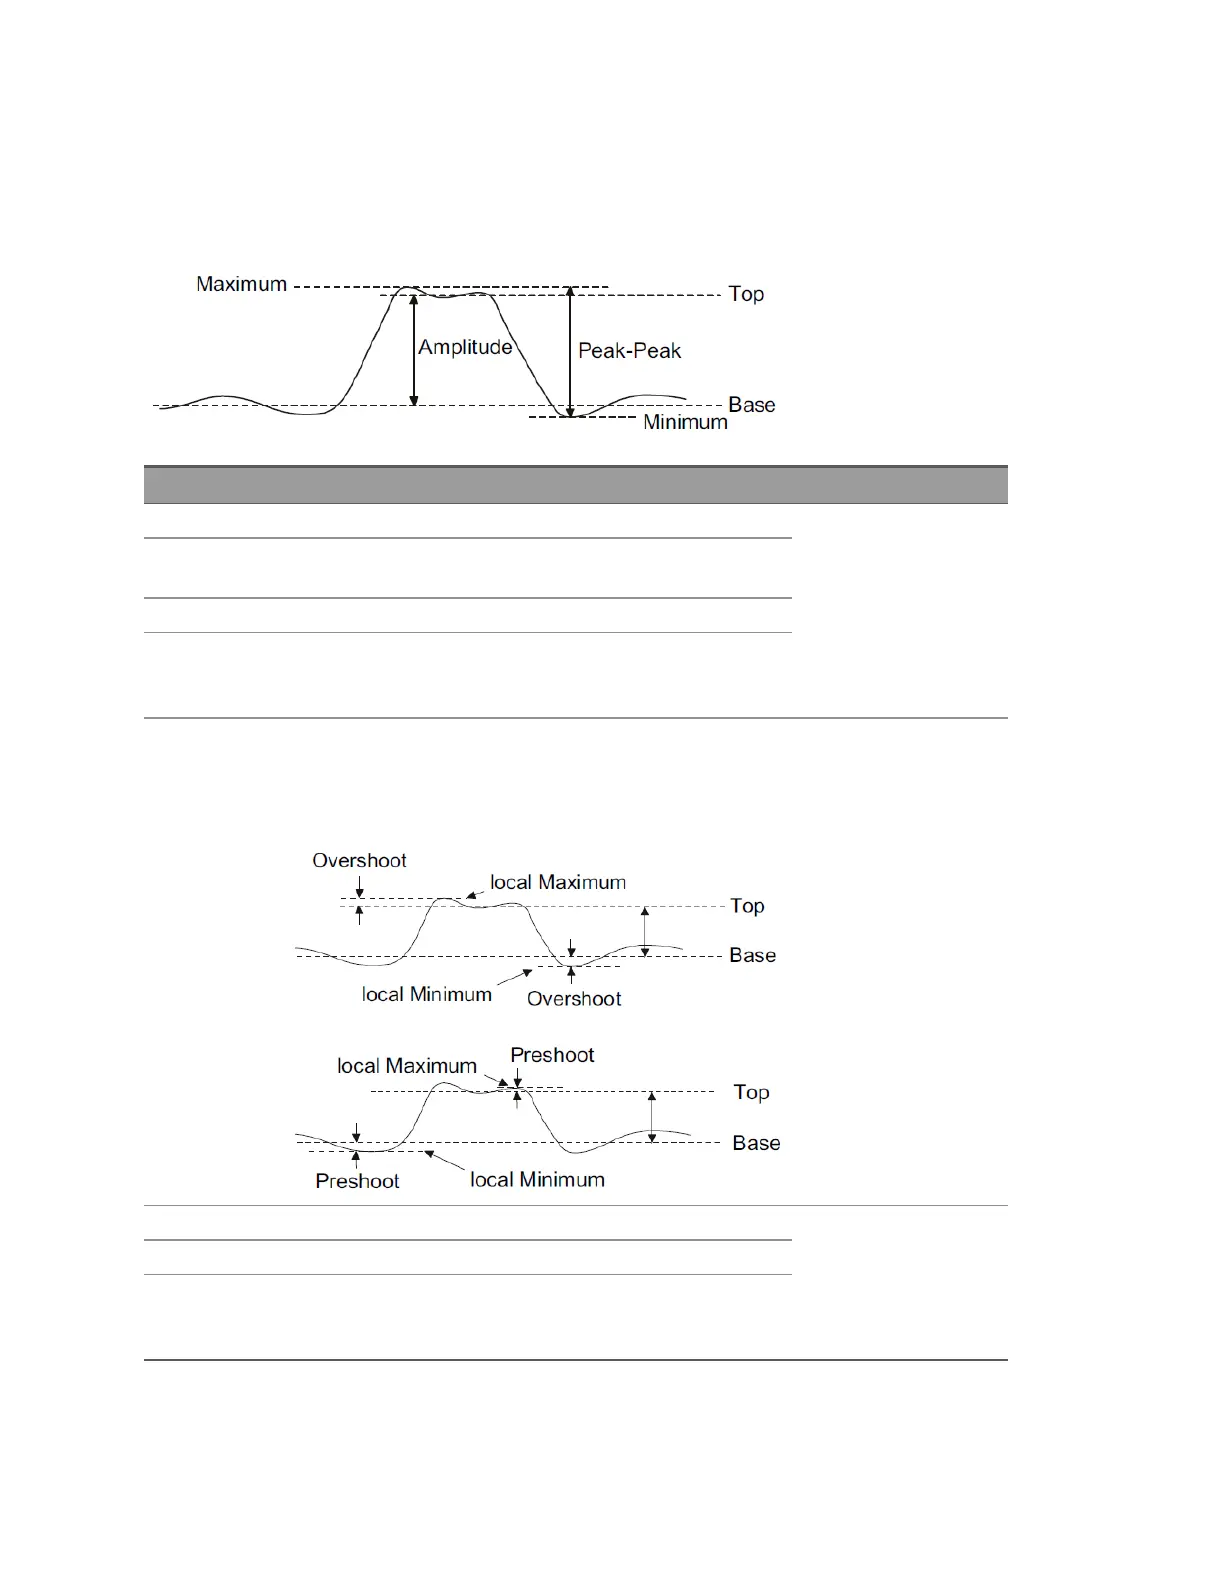
The following figure shows the measurement points for voltage, current, and power
measurements.
Measurement Description Cursors
Peak-Peak The difference between Maximum and Minimum values. The Y cursors show the
value or values being
measured.
Maximum and
Minimum
The highest and lowest values.
Amplitude The difference between the Top and Base values.
Top and Base Modes (most common values) of the upper and lower
parts of the waveform. If a mode is not well defined, these
are set to the Maximum and Minimum.
Overshoot and
preshoot
Distortions that follow (overshoot) or precede (preshoot)
an edge transition, expressed as the difference between
the Minimum or Maximum and the Top or Base as a
percentage of Amplitude.
The X cursors show
which edge is being
measured (edge closest
to the trigger reference
point).
Average The arithmetic mean of the samples. The X cursors show
what interval of the
waveform is being
measured.
DC RMS The root-mean-square value over one or more full periods.
AC RMS The root-mean-square value with the DC component
removed. This is useful, for example, for measuring
power supply noise.
98 Keysight IntegraVision PA2200 Series Power Analyzers Operating and Service Guide

 Loading...