Parameter /
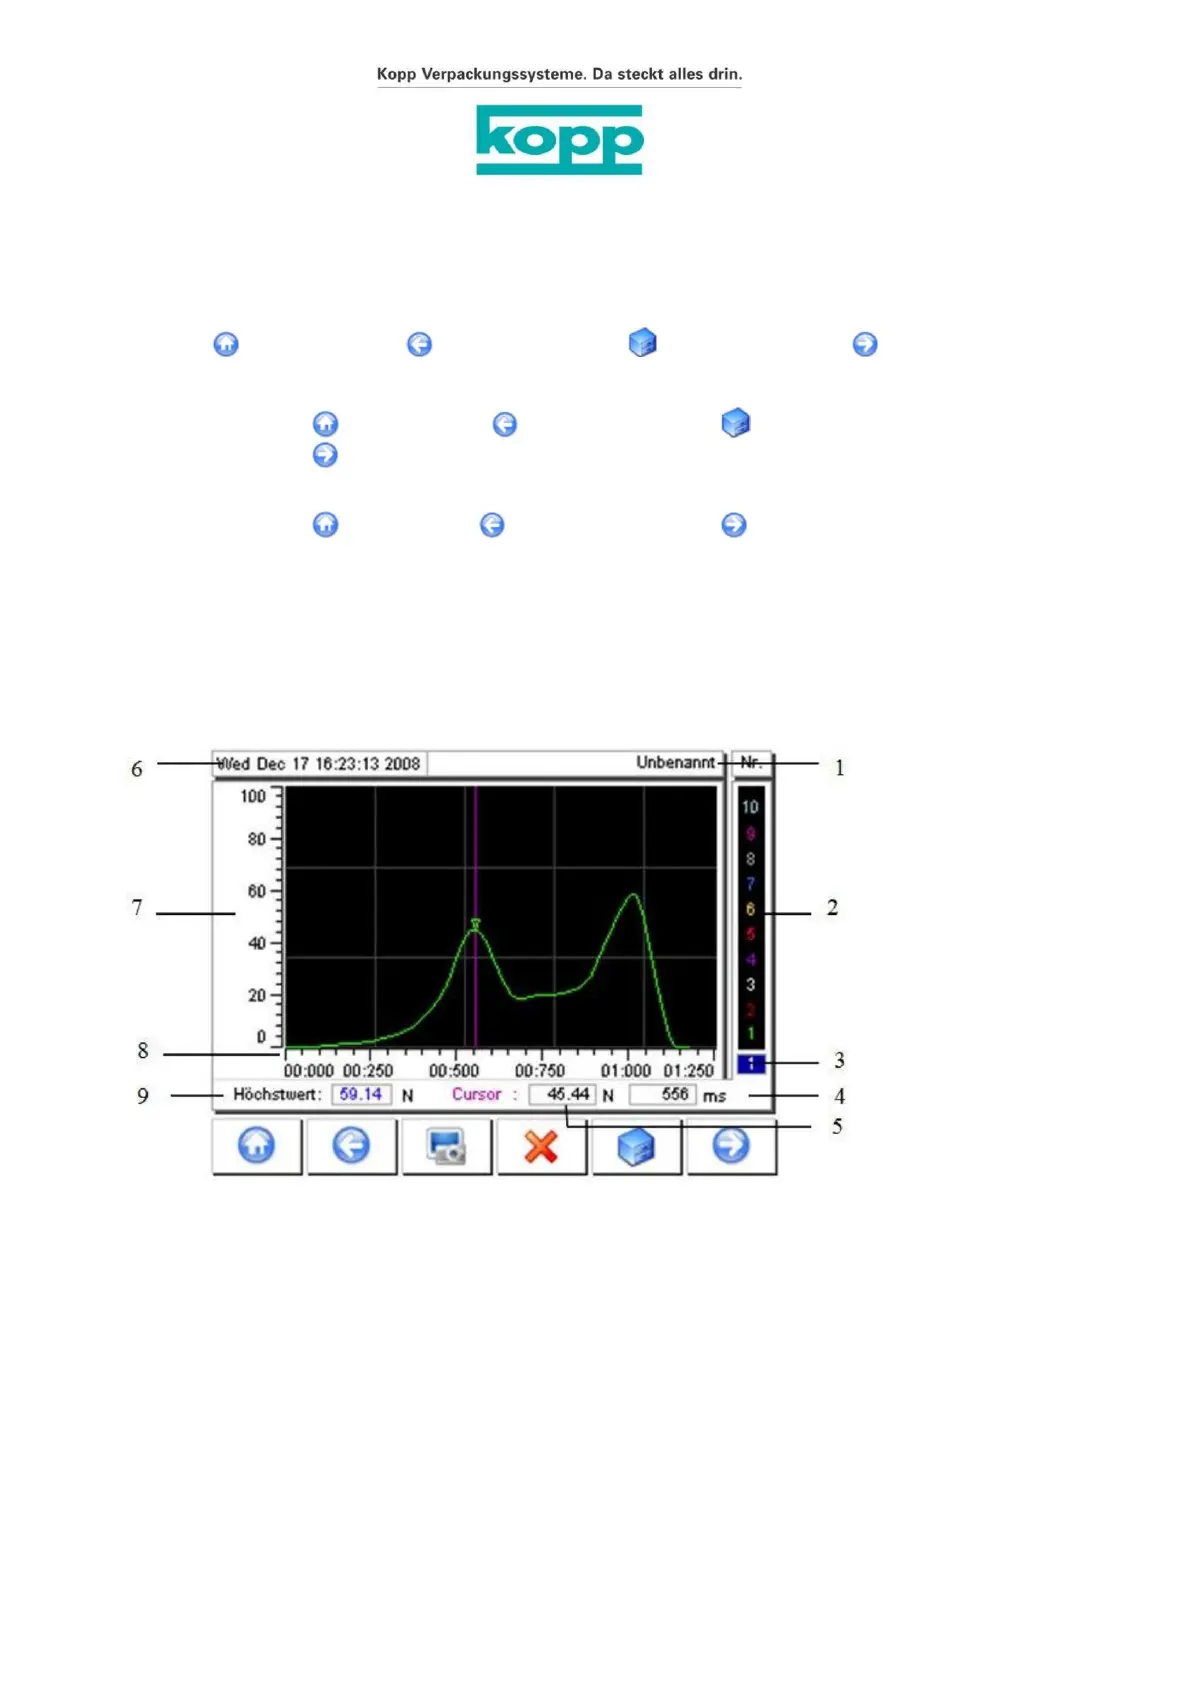
The force/time curve of the recorded measurement data is displayed in the curve evaluation view:
Display of results/curve evaluation
y-axis – force in [N]
File management /
5.3.7. Curve evaluation
ÿ Experiment description
Main menu /
Main menu /
Seal seam strength tester Labormaster HCT 3000
Main menu /
Operating instructions and technical description
Up to 10 curves can be displayed. Each curve is assigned an order number. The colors of the order numbers
correspond to the color of the curve display.
Curve evaluation / file management /
Page - 37 -
Experiment description
Presentation of results
x-axis – time in [ms]
ÿ Presentation of results
Fax +49.7153.9510-100
Inh. Ludwig P. Goals
Phone +49.7153.9510-0
D-73262 Reichenbach/Fils
Packaging systems
Willi Kopp e. K
http://www.kopp-online.de
Ulmer Straße 51 – 53
Figure 17 / Curve display
E-Mail: sales@kopp-online.de
Labormaster Version 2.6.3 SW 2.2 from 03/2016 Page 37 of 82, March 1, 2016
Subject to errors and technical changes!
Machine Translated by Google