Operator's Manual
94 WS-OM-E Rev B
5. Select another “Px” location and parameter, or touch Close.
Parameter Calculations
Parameters and How They Work
Determining Top and Base Lines
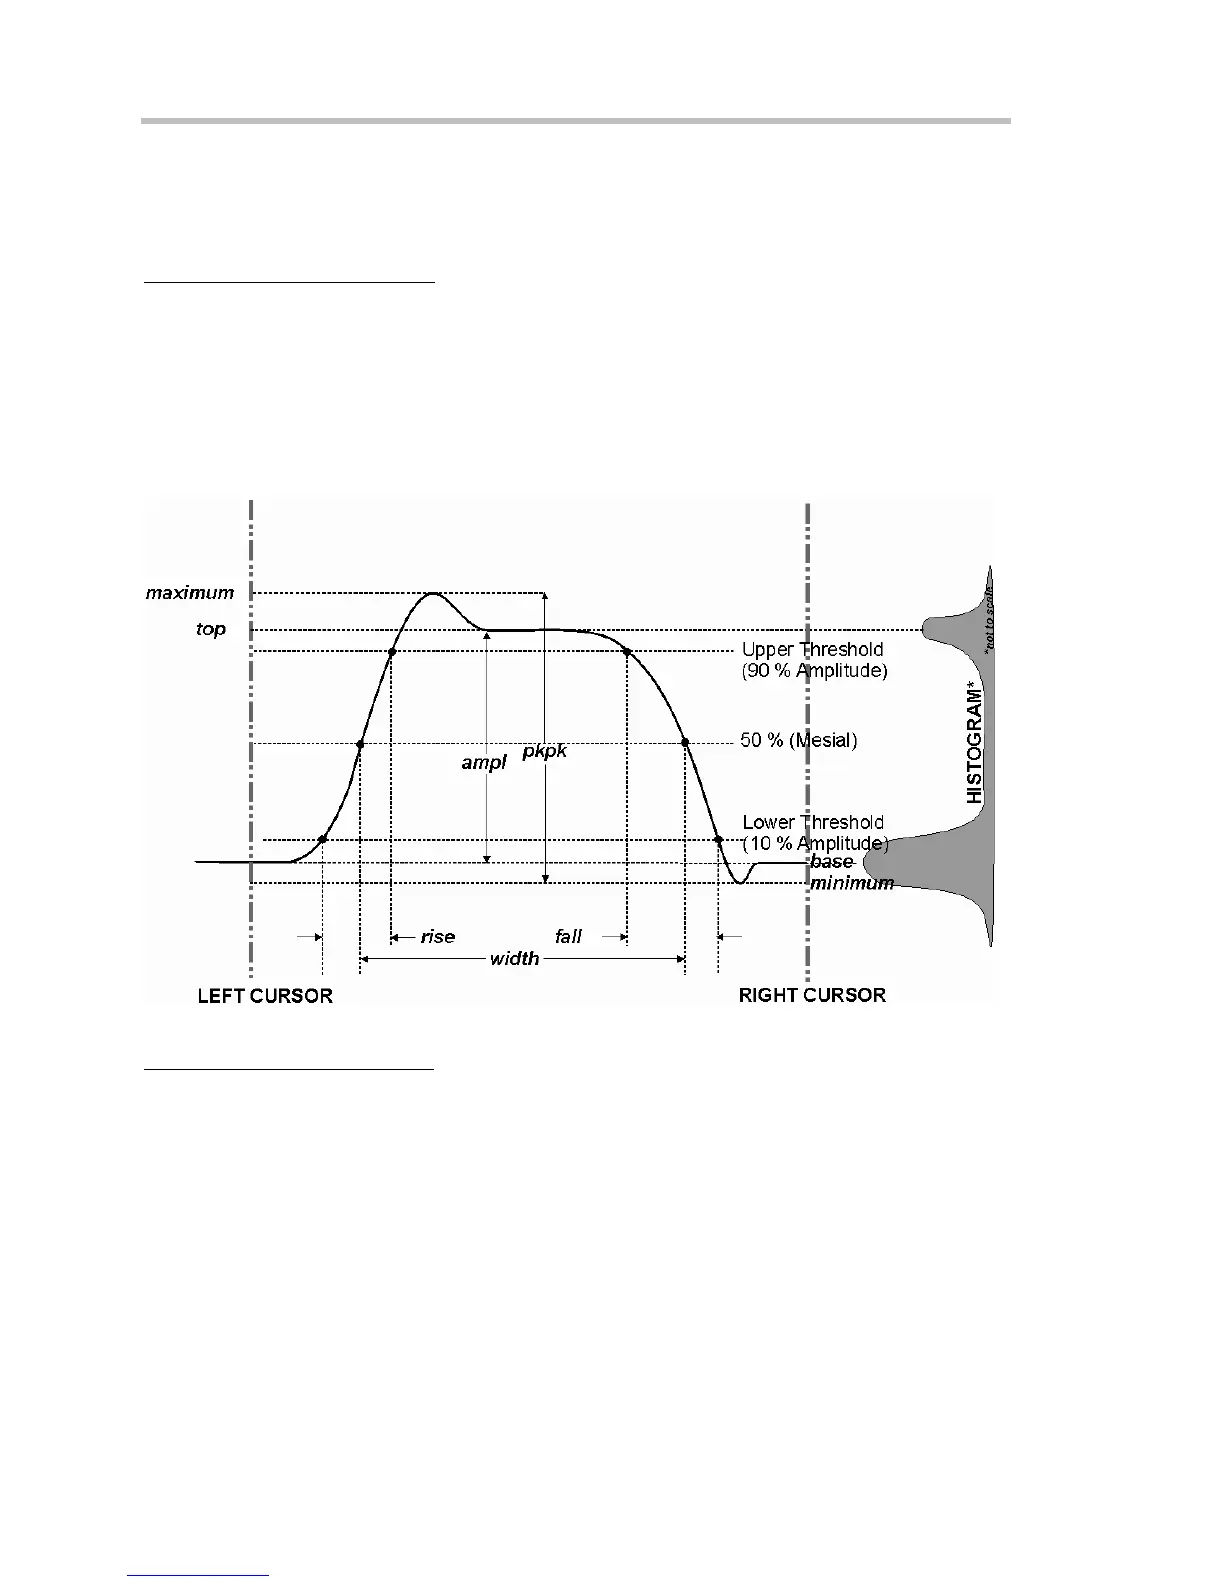
Proper determination of the top and base reference lines is fundamental for ensuring correct
parameter calculations. The analysis begins by computing a histogram of the waveform data over
the time interval spanned by the left and right time cursors. For example, the histogram of a
waveform transitioning in two states will contain two peaks (see Figure 1). The analysis will
attempt to identify the two clusters that contain the largest data density. Then the most probable
state (centroids) associated with these two clusters will be computed to determine the top and
base reference levels: the top line corresponds to the top and the base line to the bottom
centroid.
Figure 1
Determining Rise and Fall Times
Once top and base are estimated, calculation of the rise and fall times is easily done (see Figure
1). The 90% and 10% threshold levels are automatically determined by the DDA-5005, using the
amplitude (ampl) parameter.