Image Studio Software
4
C-DiGit User Manual 4-29
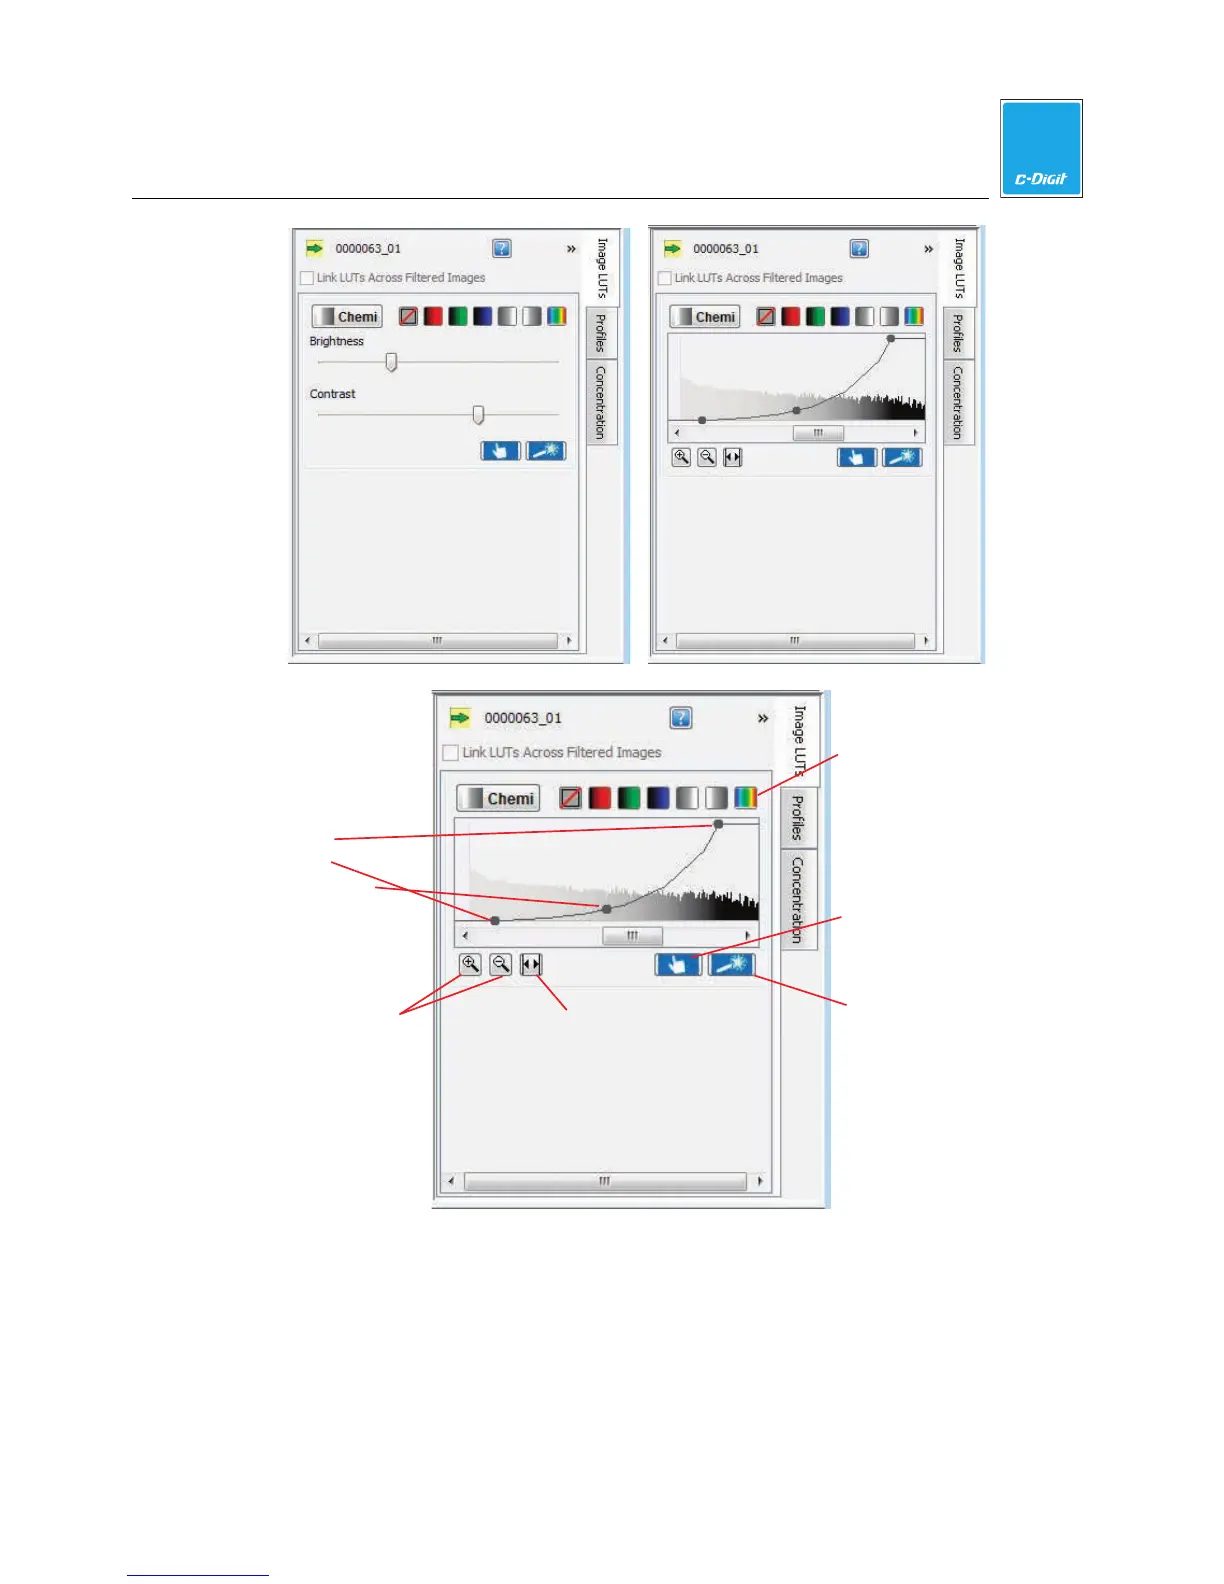
Display full
histogram
Max,
min,
K values
Color maps
Choose display
Adjust display
Zoom in/out
buttons
Histogram
The x-axis of the histogram panel represents the raw pixel values. The panel has a
bar graph displaying a histogram of the number of pixels with each raw value. The
higher the bar at a given location on the x-axis, the more pixels that contain that
particular intensity value. This histogram is shaded with the color map in use for
that channel. Also shown in the panel is an adjustable curve that maps raw data to
display data.