Image Studio Software
4
C-DiGit User Manual 4-32
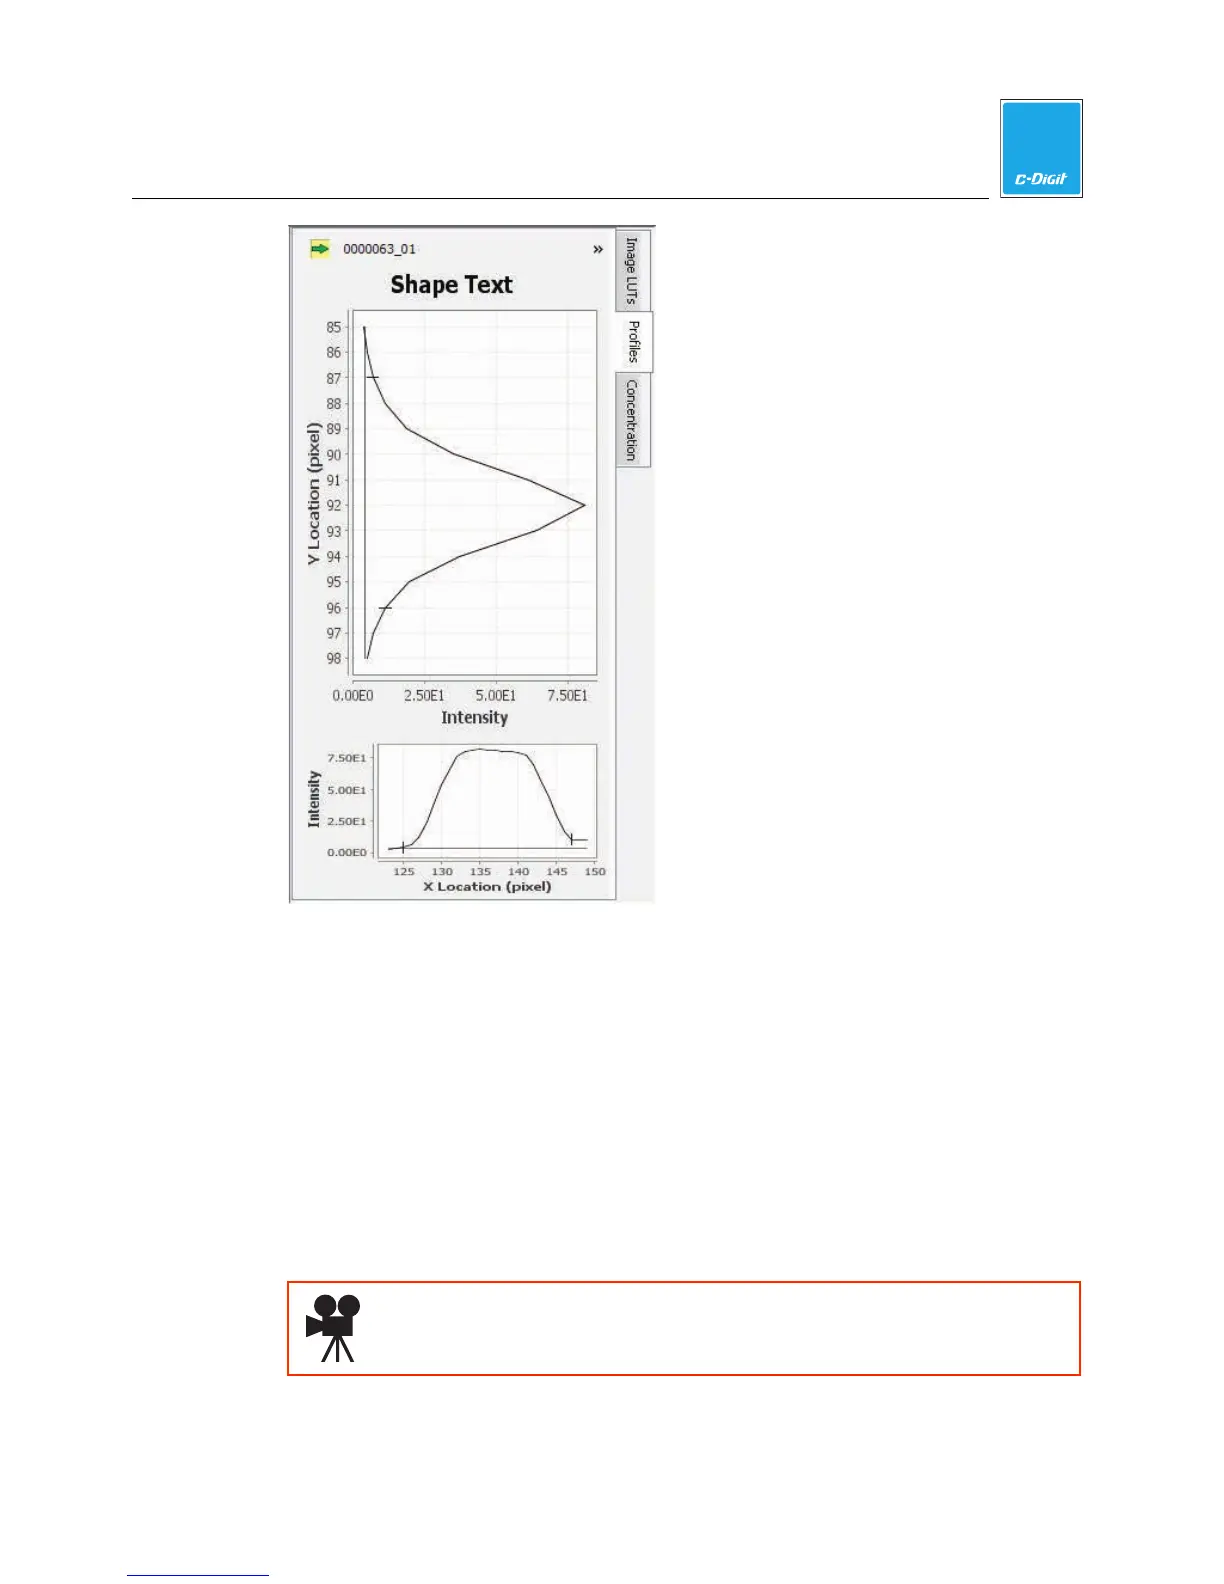
1. Select a single band or shape and click the Profiles tab. The profile panel is
displayed.
2. The profile graphs map the intensity values of the selected shape(s), and show
the location of the highest intensity pixel along both x and y axes (X Location
and Y Location).
Concentration
The Concentration tab allows you to view the concentration standards; the
standards and concentrations are entered into columns on the Shapes table; the
concentration of all other features on the image is then calculated and displayed in
the table. You can add concentration standards to any analysis.
Click here to watch a video that demonstrates how to quantify data.