RETeval Flicker Option
RET
eval
Device User Manual 27
Historical results can be seen from the main menu Results option. Scroll up and down through
the list and select the desired test result. The results are stored in chronological order; with the
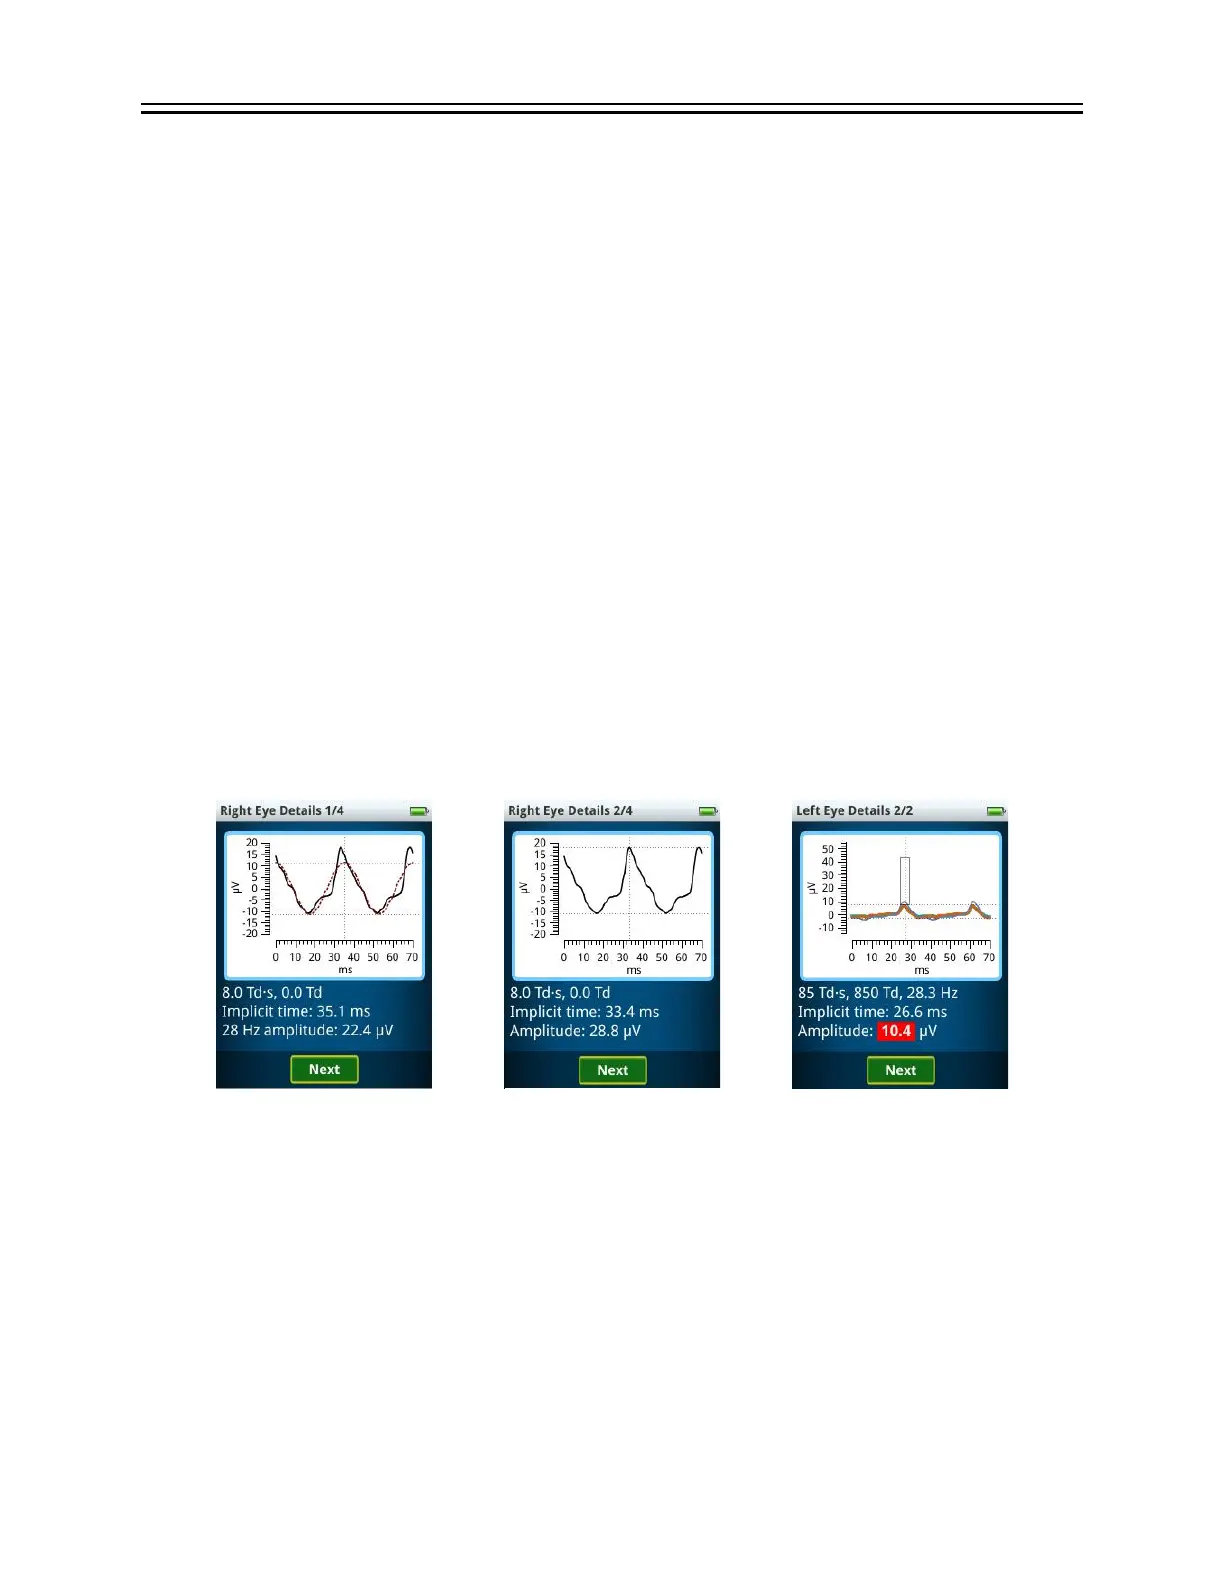
most recent result first. The summary shown above is displayed, as well as the stimulus, electrical
amplitudes, and waveforms recorded by the Sensor Strips for each eye for each step. In the
electrical waveform, two periods are shown. The light flashes stimulating the retina occurred at
time = 0 ms and near time = 35 ms. Amplitudes and timing measurements and reported for both
the fundamental of the response (i.e., the best-fitting sinusoid) and the whole waveform,
because the scientific literature supports both methods. Using the fundamental has been
reported to be more accurate for managing patients with ischemia (Severns, Johnson, and
Merritt 1991) and more robust to the lighting conditions the patient experienced before the test
(McAnany and Nolan 2014), while using the whole waveform matches the ISCEV standard
(McCulloch et al. 2015) and is diagnostically more useful in some cases (Maa et al. 2016). The
black curve represents the electrical response of the eye to the flickering light. The red dashed
curve (when present) represents the fundamental of the electrical response. Amplitude is
reported as peak-to-peak. The dotted lines indicate the measurement values extracted from the
waveforms. When reference intervals are available, a rectangular box is shown that encloses
95% of the data in the visually-normal test population. Cursor measurements outside the
rectangular box are therefore atypical. Atypical measurements associated with disease (long
times or small amplitudes) are highlighted in red (i.e., < 2.5% for amplitudes or > 97.5% for times).
Measurements close to the border of being highlighted red (the next 2.5%), are highlighted in
yellow. See the Reference Intervals section in the manual (starting on page 67) for further
details.
PDF reports show three periods of the electrical response recorded by the Sensor Strips. In the
electrical response, the light flashes stimulating the retina occurred at time = 0 ms, 35 ms and 70
ms.
Just before “Start Test” is pressed in flicker tests, the RET
eval
device attempts to measure pupil
size regardless of the stimulus type selected. If the pupil is successfully measured, its diameter
will be shown in the PDF report at that test step. If the pupil size is not successfully measured
before “Start Test”, which is possible for “cd” tests, the device will continue to try measuring the
pupil size during the test and will instead report the average pupil diameter during the test.