Viewing Results
RET
eval
Device User Manual 16
Viewing Results
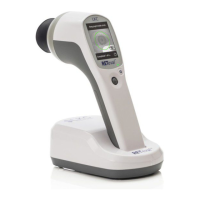
Results on the device
The DR Assessment protocol combines implicit time, amplitude, age, and
pupil response to create a unified result, which is shown immediately
after the test completes.
Diabetics with vision-threatening diabetic retinopathy typically have
larger results. For more information, refer to the DR Assessment
protocol description on Page 20.
Details for the DR Assessment results can be seen by selecting Results.
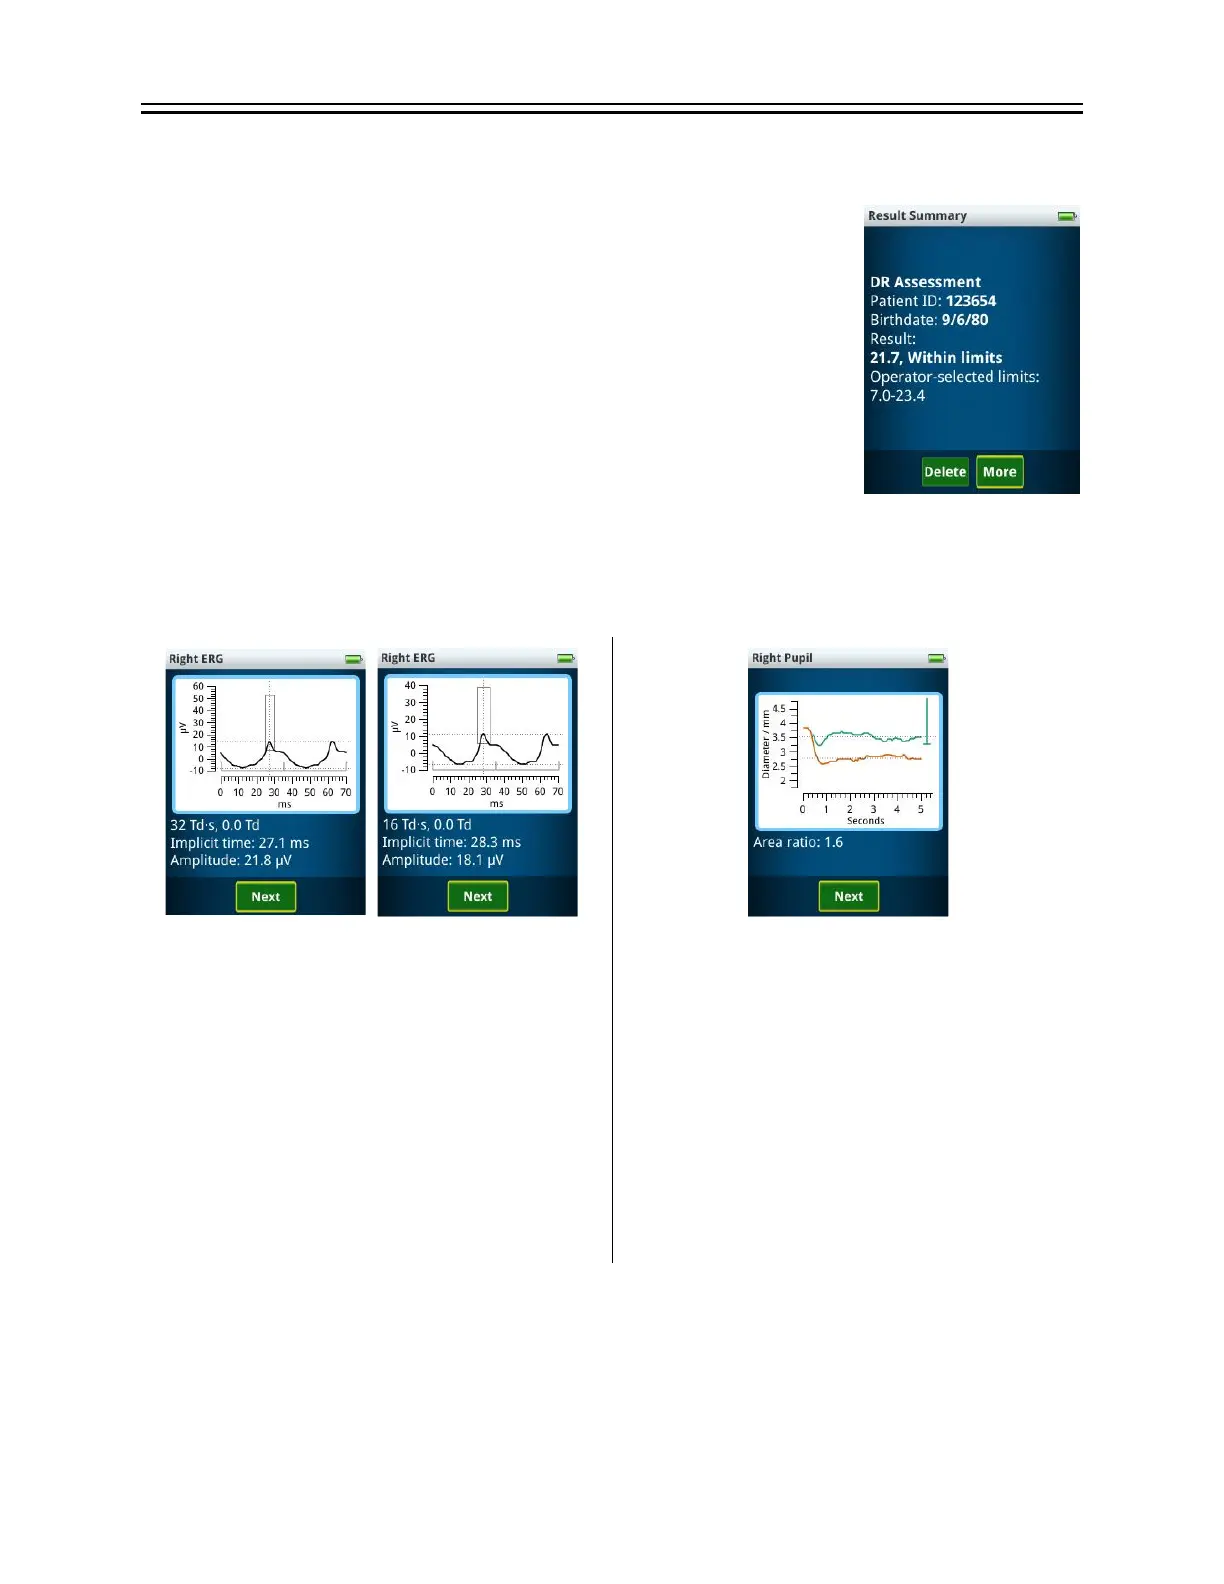
If selecting Results from the main menu, scroll up and down through
the list and select the desired test result. The results are stored in chronological order; with the
most recent result first. After showing the same summary page, the electrical and pupil
responses can be seen. The figures below show the results from the right eye; left eye results
are similarly shown.
Two periods of the electrical response, as
measured from the Sensor Strip, to a 32 Td∙s
(left) and 16 Td∙s (right) white flickering
stimulus are shown. As shown on the bottom
of the plot, the light flashes stimulating the
retina occurred at time = 0 ms and near times
= 35, 70 ms. The dotted lines indicate the
measurement points for the peak-to-peak
amplitude and implicit time (time-to-peak).
The rectangle encloses the middle 95% of
peaks in the reference data.
The pupil size as a function of time is shown
for the 4 and 32 Td∙s white flickering stimuli.
The stimuli start at time = 0. The dotted lines
show the extracted pupil diameters for the
two stimuli. The ratio of pupil areas is shown
below the plot, and it’s 95% (two-tailed)
reference interval is shown scaled for the dim
stimulus near the right edge of the plot.