RET
eval
-S test results
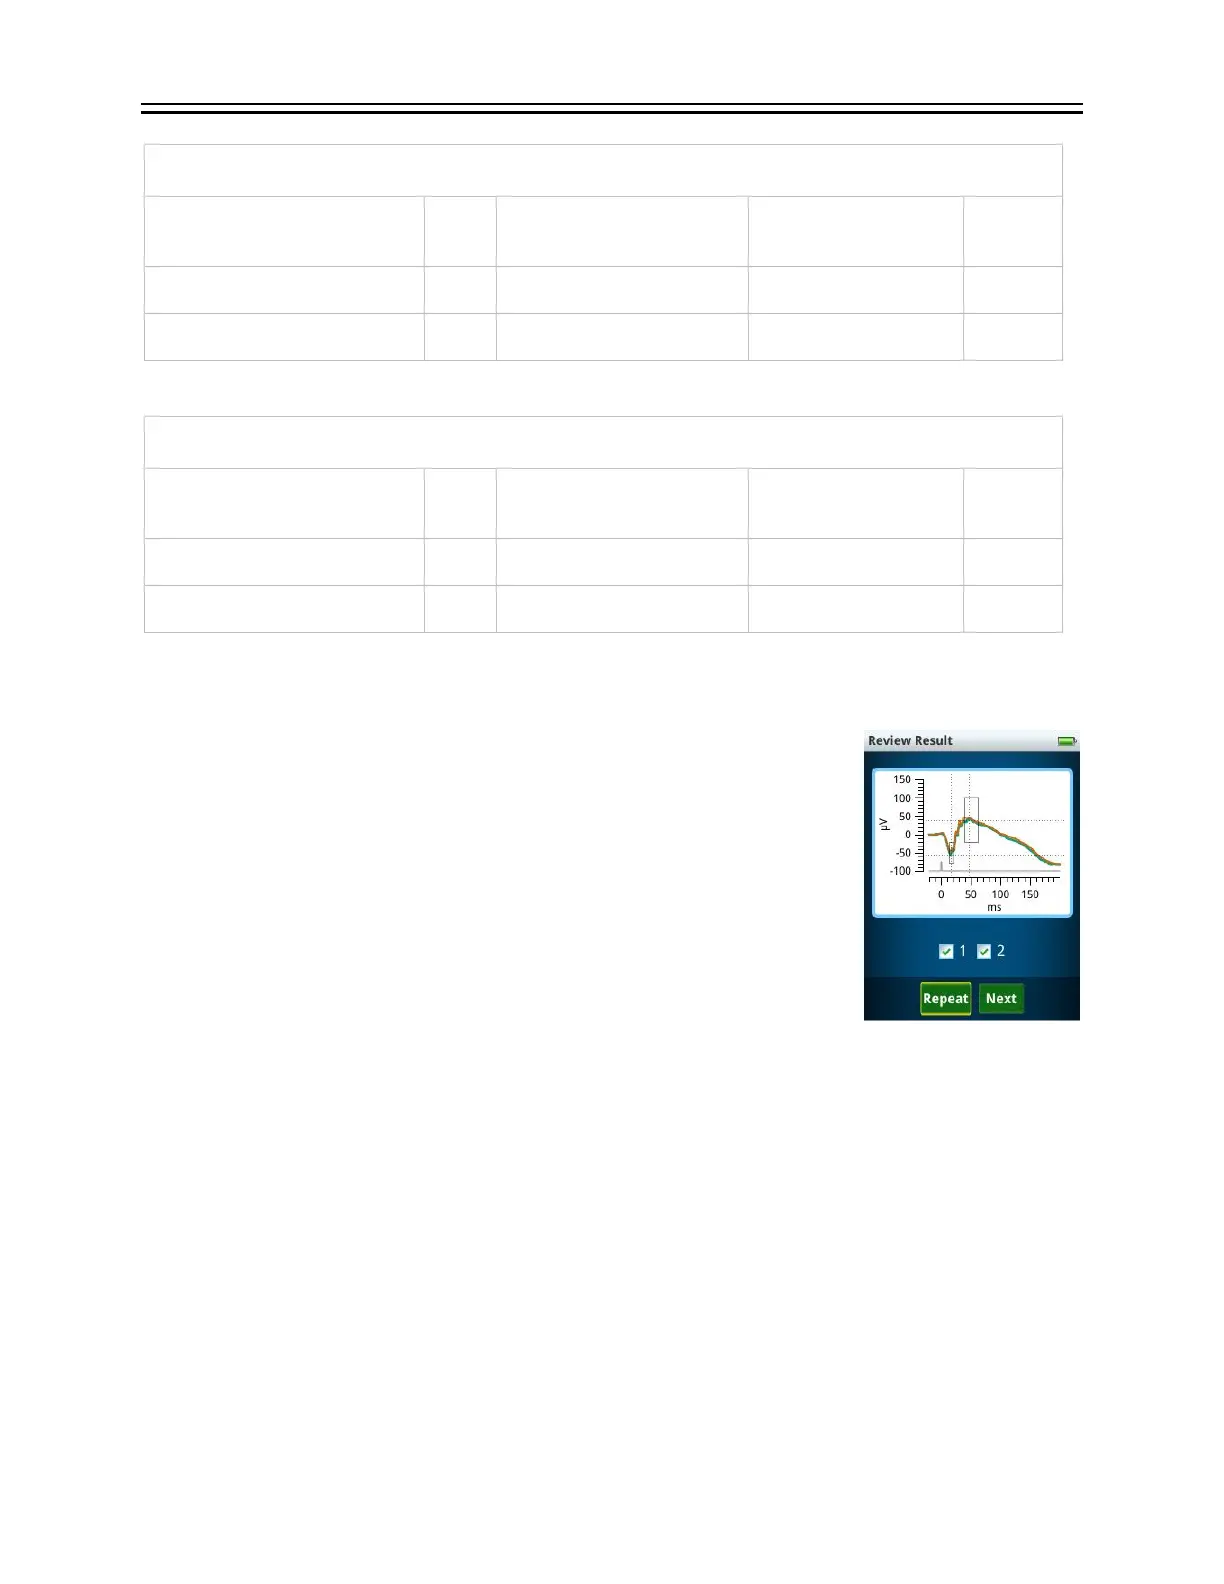
Incremental results are shown on the RET
eval
device after each test,
with the option to repeat the test or continue to the next test. Successful
cursor placement is indicated by dashed lines on the waveform
indicating their location. If you do not see the successful cursor
placement indication, repeat the measurement. Reference interval
rectangles indicating the locations of the middle 95% of subjects with
normal vision are shown.
Historical results can be seen from the main menu Results option.
Scroll up and down through the list and select the desired test result.
The results are stored in chronological order; with the most recent result
first. The results include the stimulus, electrical amplitudes, timings, and waveforms recorded
by the Sensor Strips for each eye for each step in the protocol. The graphs display the average
cursor placements. A flash occurs at time = 0 for all tests. When reference intervals are available,
a rectangle is shown that encloses 95% of the data in the visually-normal test population. Cursor
measurements outside the rectangular box are therefore atypical. Atypical measurements
associated with disease (long times or small amplitudes) are highlighted in red (i.e., < 2.5% for
amplitudes or > 97.5% for times). Measurements close to the border of being highlighted red
(the next 2.5%), are highlighted in yellow. See the Reference Intervals section in the manual
(starting on page 67) for further details.
Just before “Start Test” is pressed in flicker or flash tests, the RET
eval
device attempts to
measure pupil size regardless of the stimulus type selected. If the pupil is successfully measured,
its diameter will be shown in the PDF report at that test step. If the pupil size is not successfully
measured before “Start Test”, which is possible for “cd” tests, the device will continue to try