Reference Intervals
RET
eval
Device User Manual 68
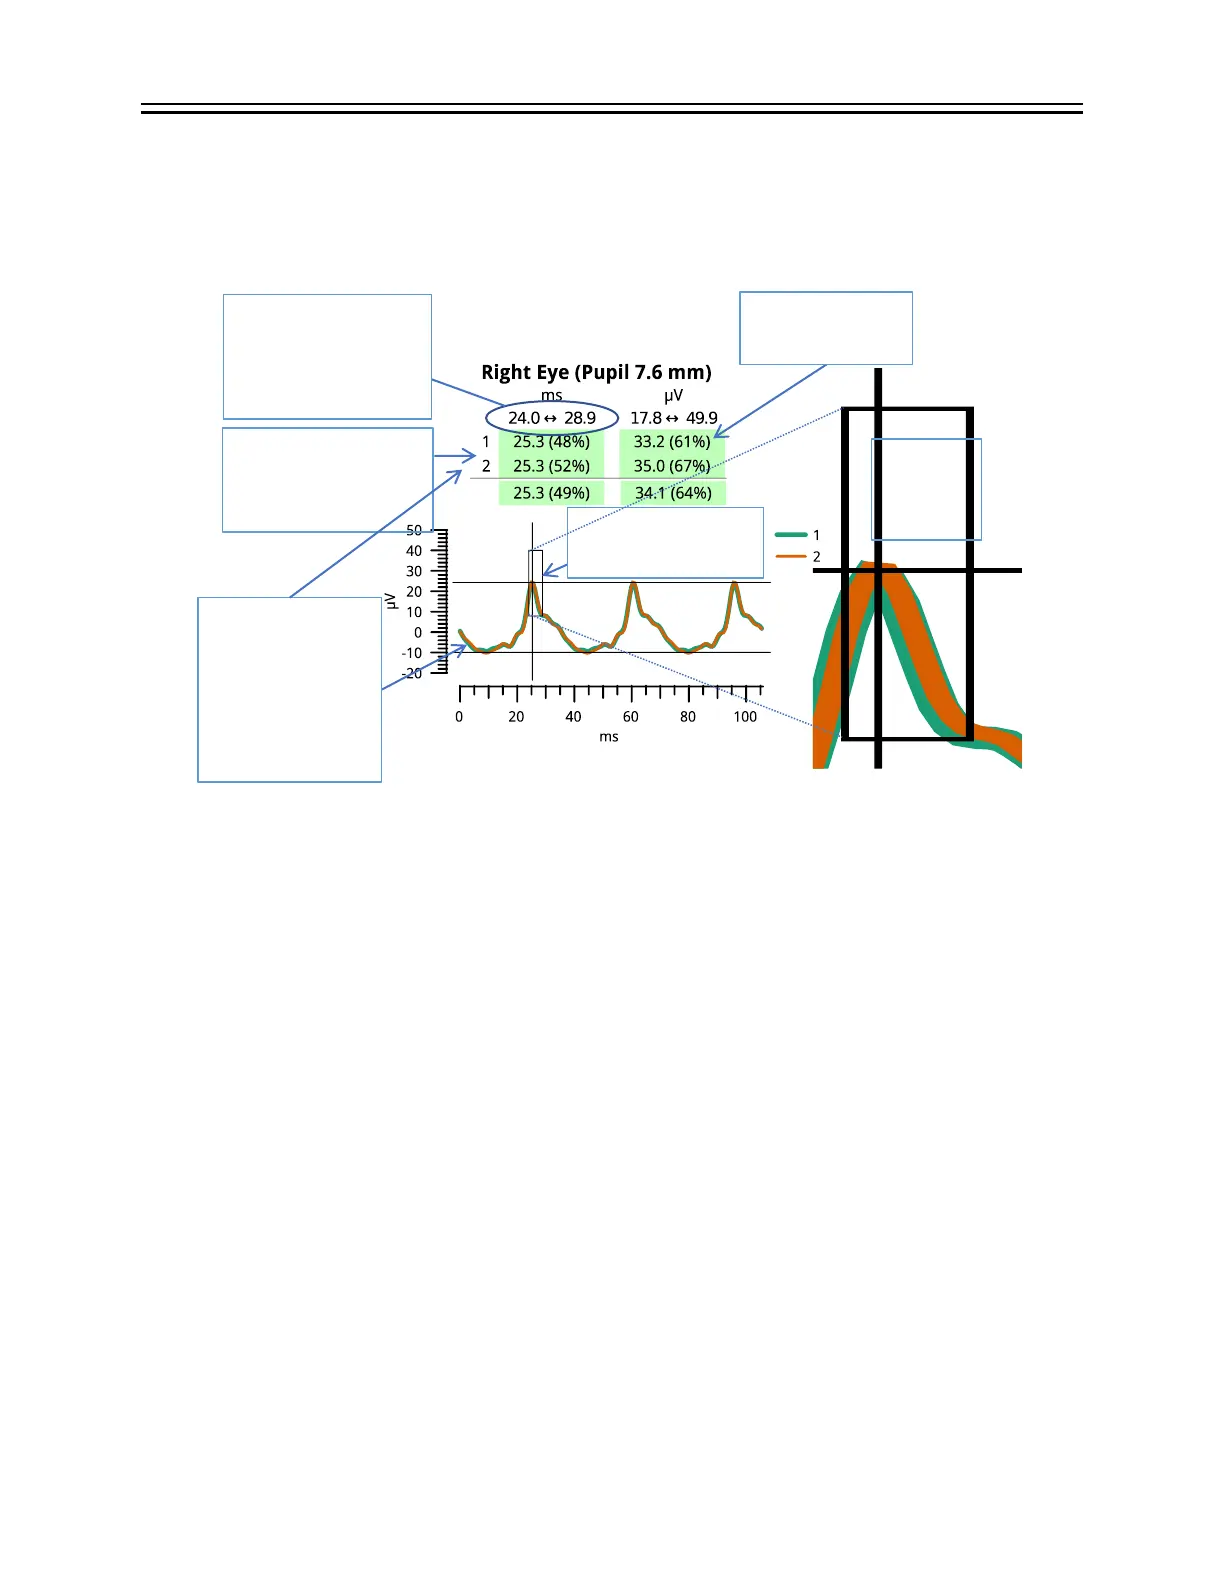
tailed reference interval). Thus, it would be atypical for a patient with normal vision to have an
ERG waveform peak outside this rectangular box. An atypical result may still be colored green if
it is not associated with disease (coloring follows the 1-tailed reference interval).
Using reference intervals as clinical decision limits
Clinicians must exercise judgement in the interpretation of a patient’s result when compared to
reference data. Never draw diagnostic conclusions from a single exam, and heed the subject’s
medical history. It is the clinician’s responsibility to make diagnostic interpretations of RET
eval
measurements.
Test specificity
Test specificity is the probability a test correctly identifies healthy subjects. About 1 in 40 visually-
normal subjects will be flagged as “red” and another 1 in 40 visually-normal subjects will be
flagged as “yellow”. Thus, 1 in 20 visually-normal subjects (5%) will not be marked as “green”.
Thus, if the reference interval is used as a clinical decision limit, the test specificity for “green”
results is 95% and for “green or yellow” results is 97.5%.
Test sensitivity
Test sensitivity is the probability that a test will identify a diseased subject. Reference intervals
are constructing only using healthy subjects. The effect that a particular disease on any given
test may be very large, or may be nothing at all. By having 1-tailed reference intervals and only
flagging atypical results in the direction associated with eye disease, test sensitivity is improved
over 2-tailed reference intervals.
 Loading...