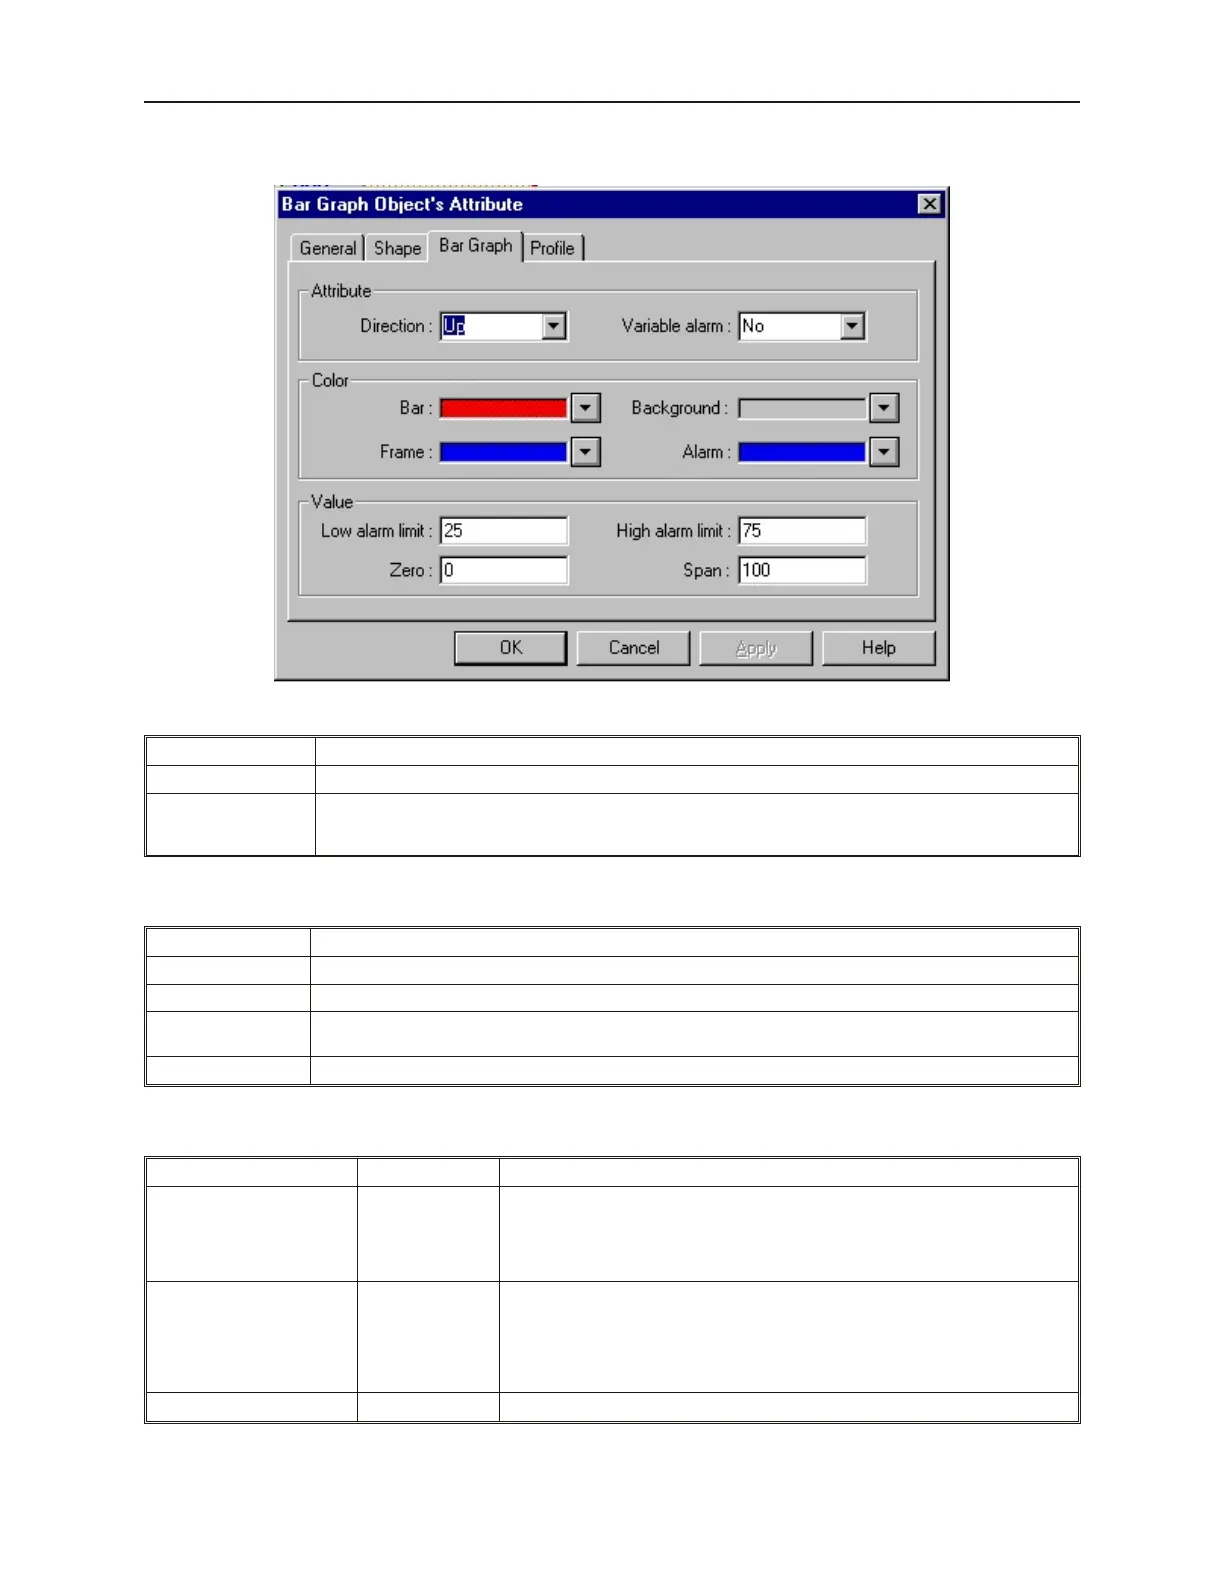
7. Click the Bar Graph tab to display the Bar Graph form.
8. In the Attribute frame, select what type of Bar Graph to use:
Function Description
Direction: Selects which direction the bar graph should move as it increases: Up, Down, Right, or Left.
Variable alarm:
If the Variable alarm feature is selected, then the OIT continuously reads three 16-bit PLC registers
instead of 1. The first register stores the current value of the bar graph. The second register stores the
Low alarm limit. The third register stores the High alarm limit
9. In the Color frame box, select the following:
Function Description
Bar: Selects the color for the bar graph indicator bar.
Background: Selects the color for the background of the bar graph.
Frame:
Selects the color for the frame. If you do not want a frame, then select the same color as used for the
background color.
Alarm: Selects the color used to indicate an alarm or out-of-range condition.
10. In the Value frame box, select the following:
Function Range Description
Low alarm limit: -32768 to 32766
During operation, if the PLC register monitored by the bar graph goes below
this number, the alarm color is shown for the bar graph indicator bar. If you do
not want to use the alarm feature, then set this value equal to the Zero value.
If the Variable Alarm feature is enabled, this box is deactivated since the Low
alarm limit is derived from the second PLC register monitored
High alarm limit: -32767 to 32767
Like the low limit indicator, if the PLC register monitored by the bar graph goes
above this number, the alarm color is shown for the bar graph indicator bar. If
you do not want to use the alarm feature, then set this value to the Zero value
plus the Span value. If the Variable Alarm feature is enabled, this box is
deactivated since the High alarm limit is derived from the second PLC register
monitored
Zero: -32768 to 32766 Selects the number that represents the zero level for the bar graph
1010-1001a, Rev 02
Bar Graphs, Me ters, and Trends 215