may want to create a Rectangle Object that is displayed behind the Trend Graph if the Trend
Display is shown in a window screen with other objects.
7. Once the part is placed onto the window, you can adjust the attributes of the Trend Display by
double-clicking on the part.
Cre ating XY Plots
The XY Plot Object is used to sample the data in two consecutive 16-bit PLC registers and plot one register against
the other. You can configure the XY Plot as a single page or with multiple pages that can be viewed by scrolling
through the pages. The sampling rate and number of plots per page can be customized per plot. A hold feature
allows you to ‘freeze’ the graph and/or clear the graph.
4To create an XY Plot Object
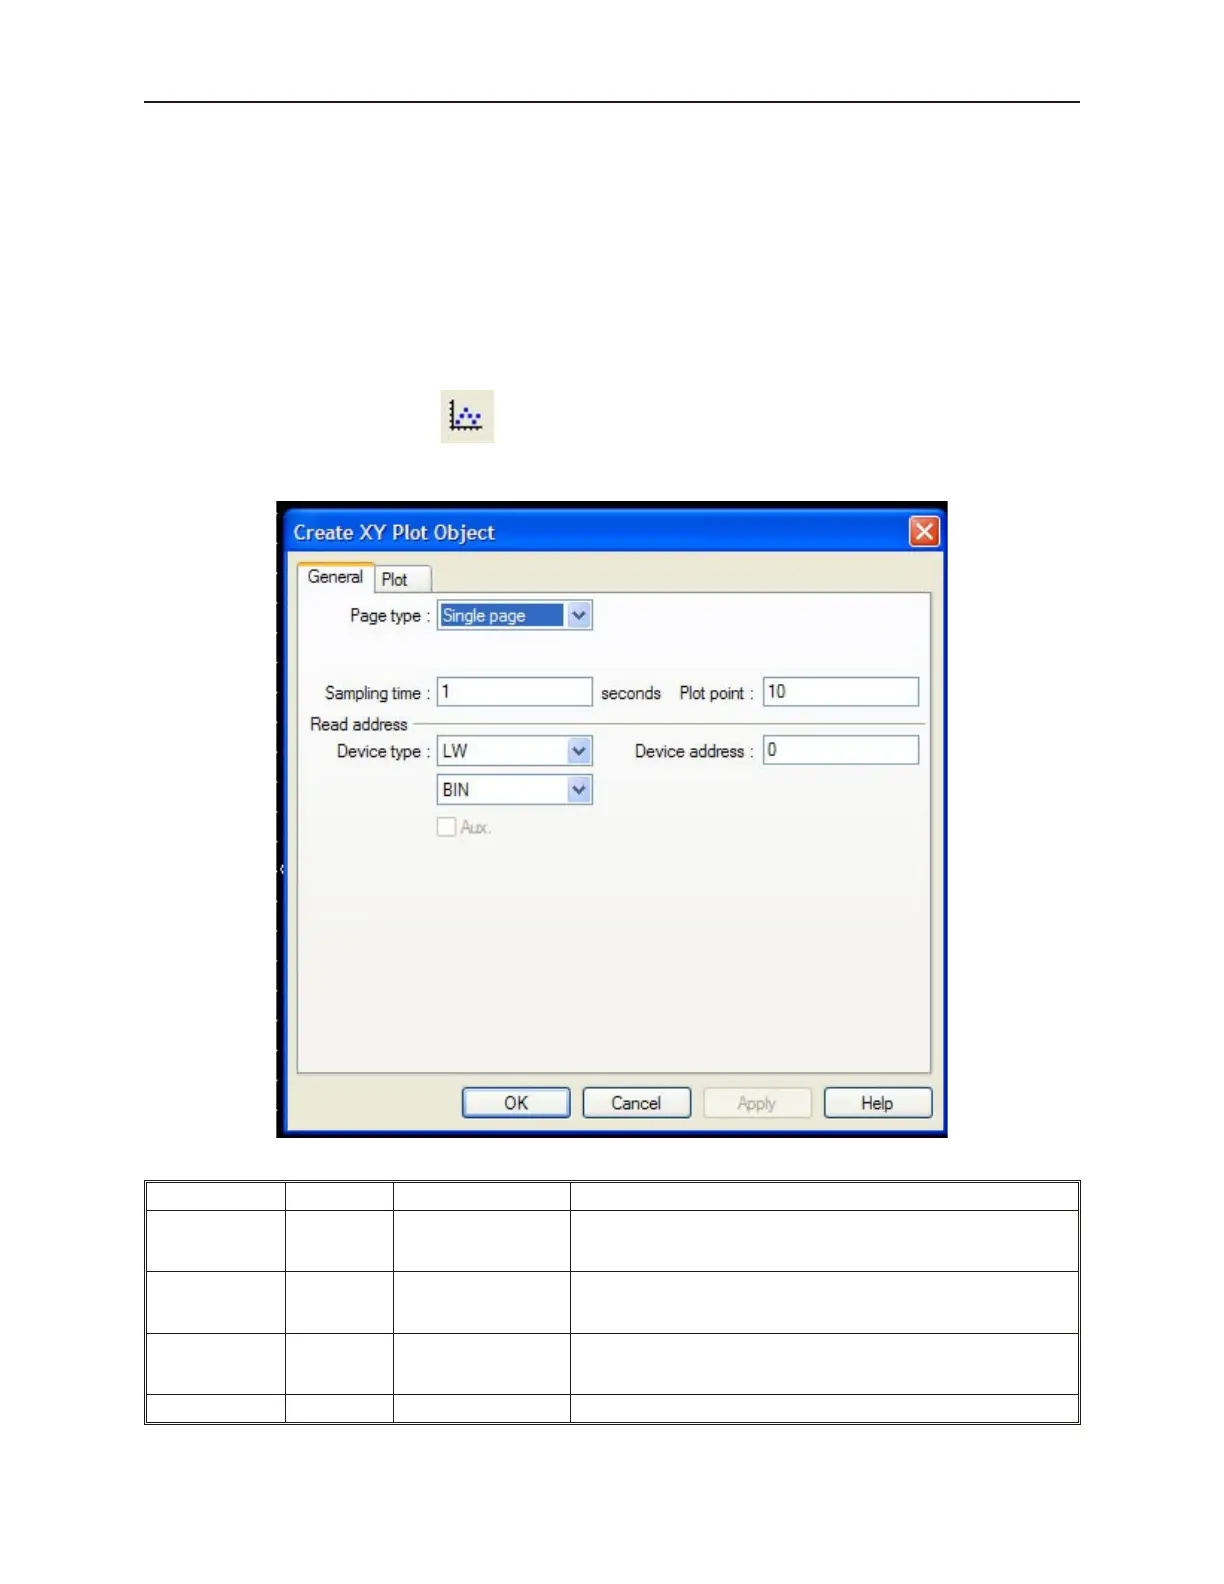
1. From the Parts menu, click XY Plot. Or click the XY Plot icon in the Part2 toolbar. The
Create XY Plot Object dialog box appears.
2. In the General frame, select the following attributes:
Function Attribute Range Description
Page Type:
Single page or
Multiple pages
Select Single page or Multiple pages. Multiple pages configure the
trend display as a ‘window’ to the trend graph in which different
segments can be viewed by scrolling.
No. of page: 1 to 31
Available if Multiple pages is selected. You can select the number
of pages you wish to view. Select 1 if you want to view a single
page only but with the hold feature enabled.
Hold style:
Hold plot display or
Hold plot display &
clear
Available if Multiple pages is selected. Select Hold plot display to
have the option of freezing the display. Select Hold plot display &
clear if you want to clear the display.
Sampling time: 1 to 65535 (seconds) Time interval between sampling and plotting of data
1010-1001a, Rev 02
220 Sil ver Se ries In stal la tion & Op er a tion Man ual