Operation and Control
37 D53182 02/2024
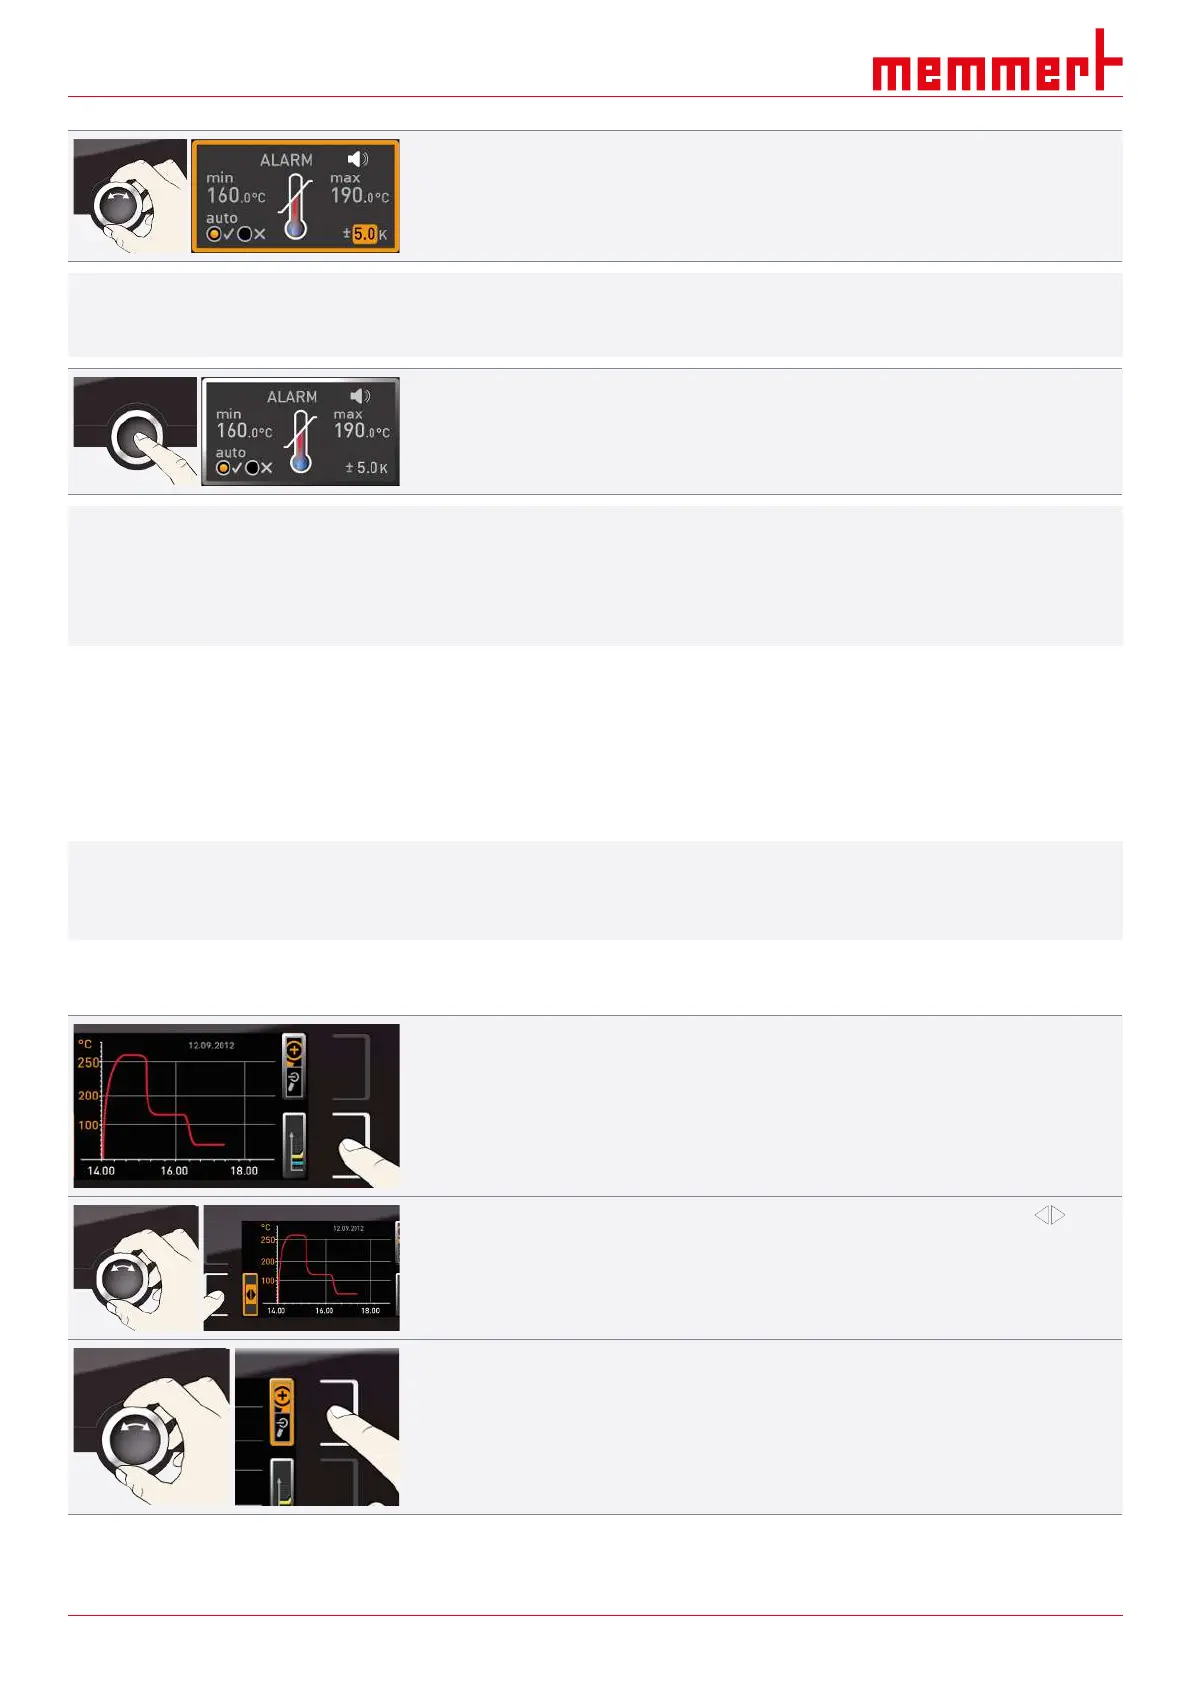
8. With the turn control, select the required tolerance band.
i
We recommend a tolerance band of 5 to 10 K.
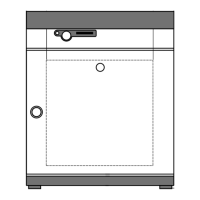
9. Press the confirmation key to confirm.
ð Temperature monitoring is now active.
i
In Menu mode, you can set:
■ which type of protection (TWW or TWB) should be active
(see }8.3.4Temperature Monitoring)
■ if an alarm should be accompanied by an acoustic signal (see }8.7Acoustic Signals)
See also
2 Acoustic Signals [}51]
2 Temperature Monitoring [}45]
6.7 Graph
i
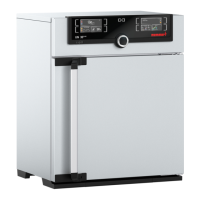
The GRAPH display provides an overview of the chronological sequence of the set values
and the actual values as a curve.
■ Press the activation key again to close the graphic display.
6.7.1 Temperature Curve
1. Press the activation key to the right of the GRAPH display.
ð The display is enlarged and the temperature curve is displayed.
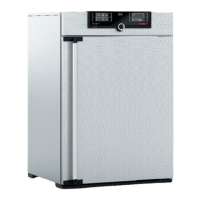
2. To change the time range to display press the activation key next to the arrow
symbols.
ð The time range to display can now be displaced by turning the turn control.
To zoom in or out in the graph:
3. Press the activation key next to the magnifying glass symbol.
4. With the turn control, select if you want to zoom in or out (+/–).
5. and confirm your selection by pressing the confirmation key.
ð To close the graphic display, press the activation key again.