■■■■■■■■■■■■■■■■■■■■■■
6 Carrying out the water content determination of a sample
■■■■■■■■
43
NOTICE
The sample size can also be adopted directly from a connected
balance.
■ The titration curve is shown live.
After the completion of the titration, the results dialog is dis-
played. If a printer is connected, then the report defined in the
method will be printed out.
Conditioning is restarted automatically in the background.
3
Carry out the two remaining water content determinations in the
same way.
If the statistics function is activated, you can have the statistics data dis-
played after the titration. Proceed as follows:
1
Opening the statistics page
■ In the main dialog, tap on [Results].
■ Tap on [Statistics].
The mean value of the result is displayed in the statistical overview.
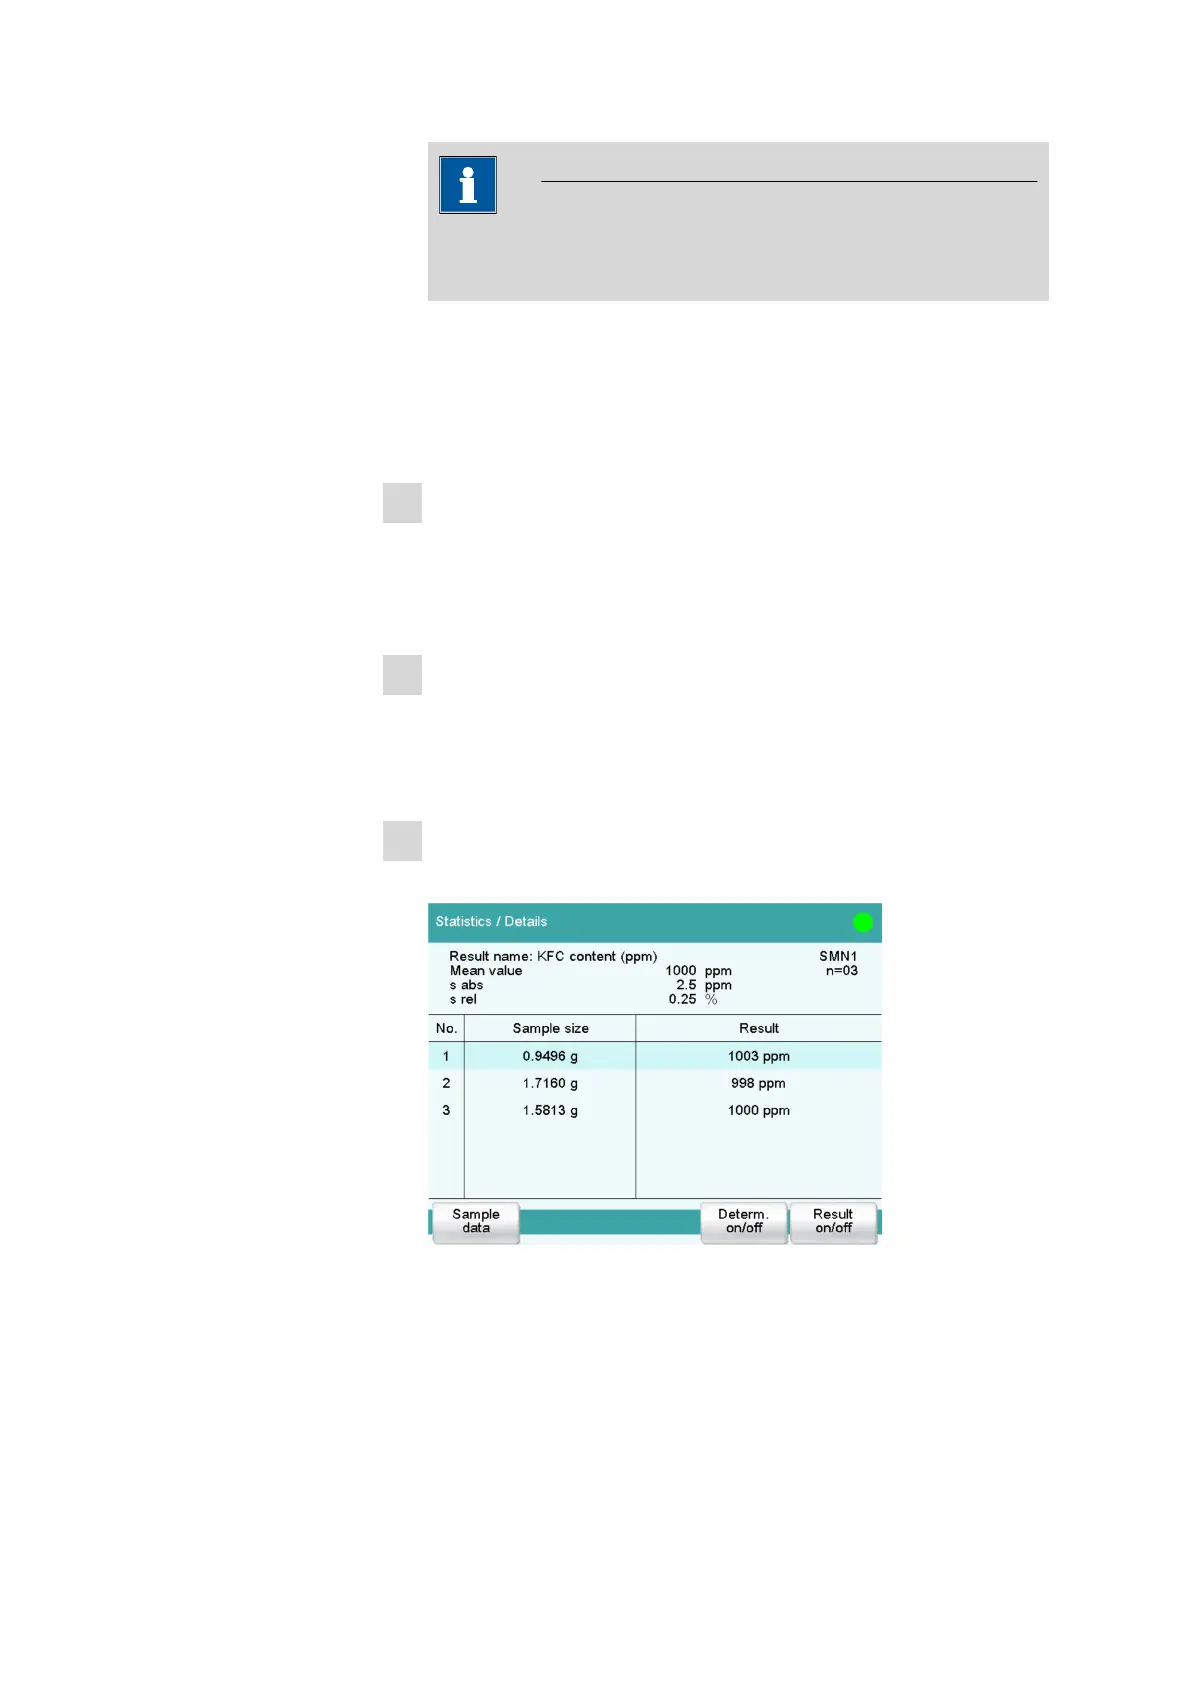
2
Displaying statistics data
Tap on [Details].
In the upper part of the display you will see the mean value of the
result as well as the absolute and the relative standard deviation. The
single results of the titrations are listed in a table.
 Loading...