Using the QC Programs
8-9
SELECT “Quality Control→ L-J Analysis→ L-J Graph→ File 1”(Figure8-9) to enter the
“L-J Graph” screen (Figure 8-10).
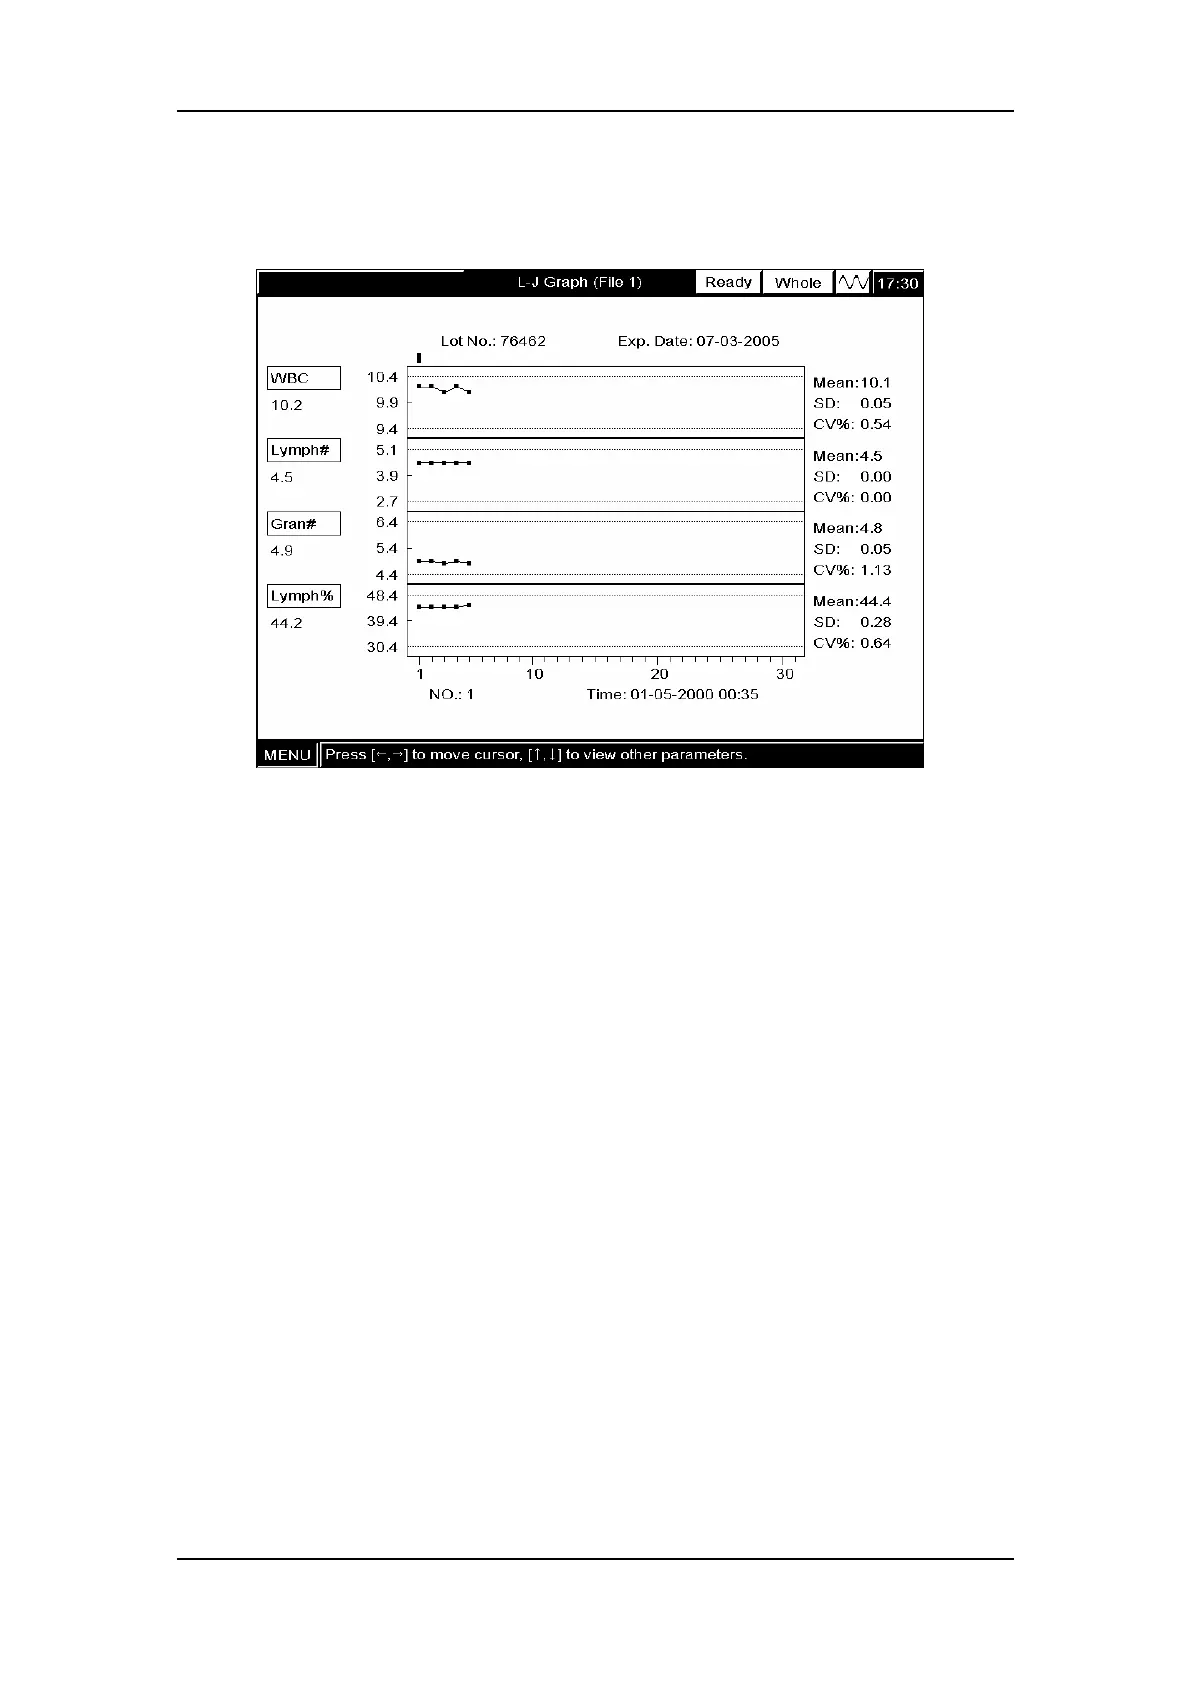
Figure 8-10 “L-J Graph”screen 1
The 12 parameters are displayed on three screens, 4 parameters on every screen, as Figure
8-10 to Figure 8-12 show. The saved QC results are sequentially displayed in the L-J graph,
the latest on the utmost left (No.1).
The L-J graph can be interpreted as follows:
The x-coordinate represents the number of the L-J analyses performed; the y-coordinate
represents the results of the L-J analyses.
For every parameter, its L-J graph can display maximum 31 points.
For every parameter, the upper dash line represents the expected result + limit.
For every parameter, the lower dash line represents the expected result – limit.
For every parameter(e.g. WBC), the three numbers to the left of the graph are:
10.4 – the expected result + limit;
9.9 – the expected result;
9.4 – the expected result – limit.