Using the QC Programs
8-48
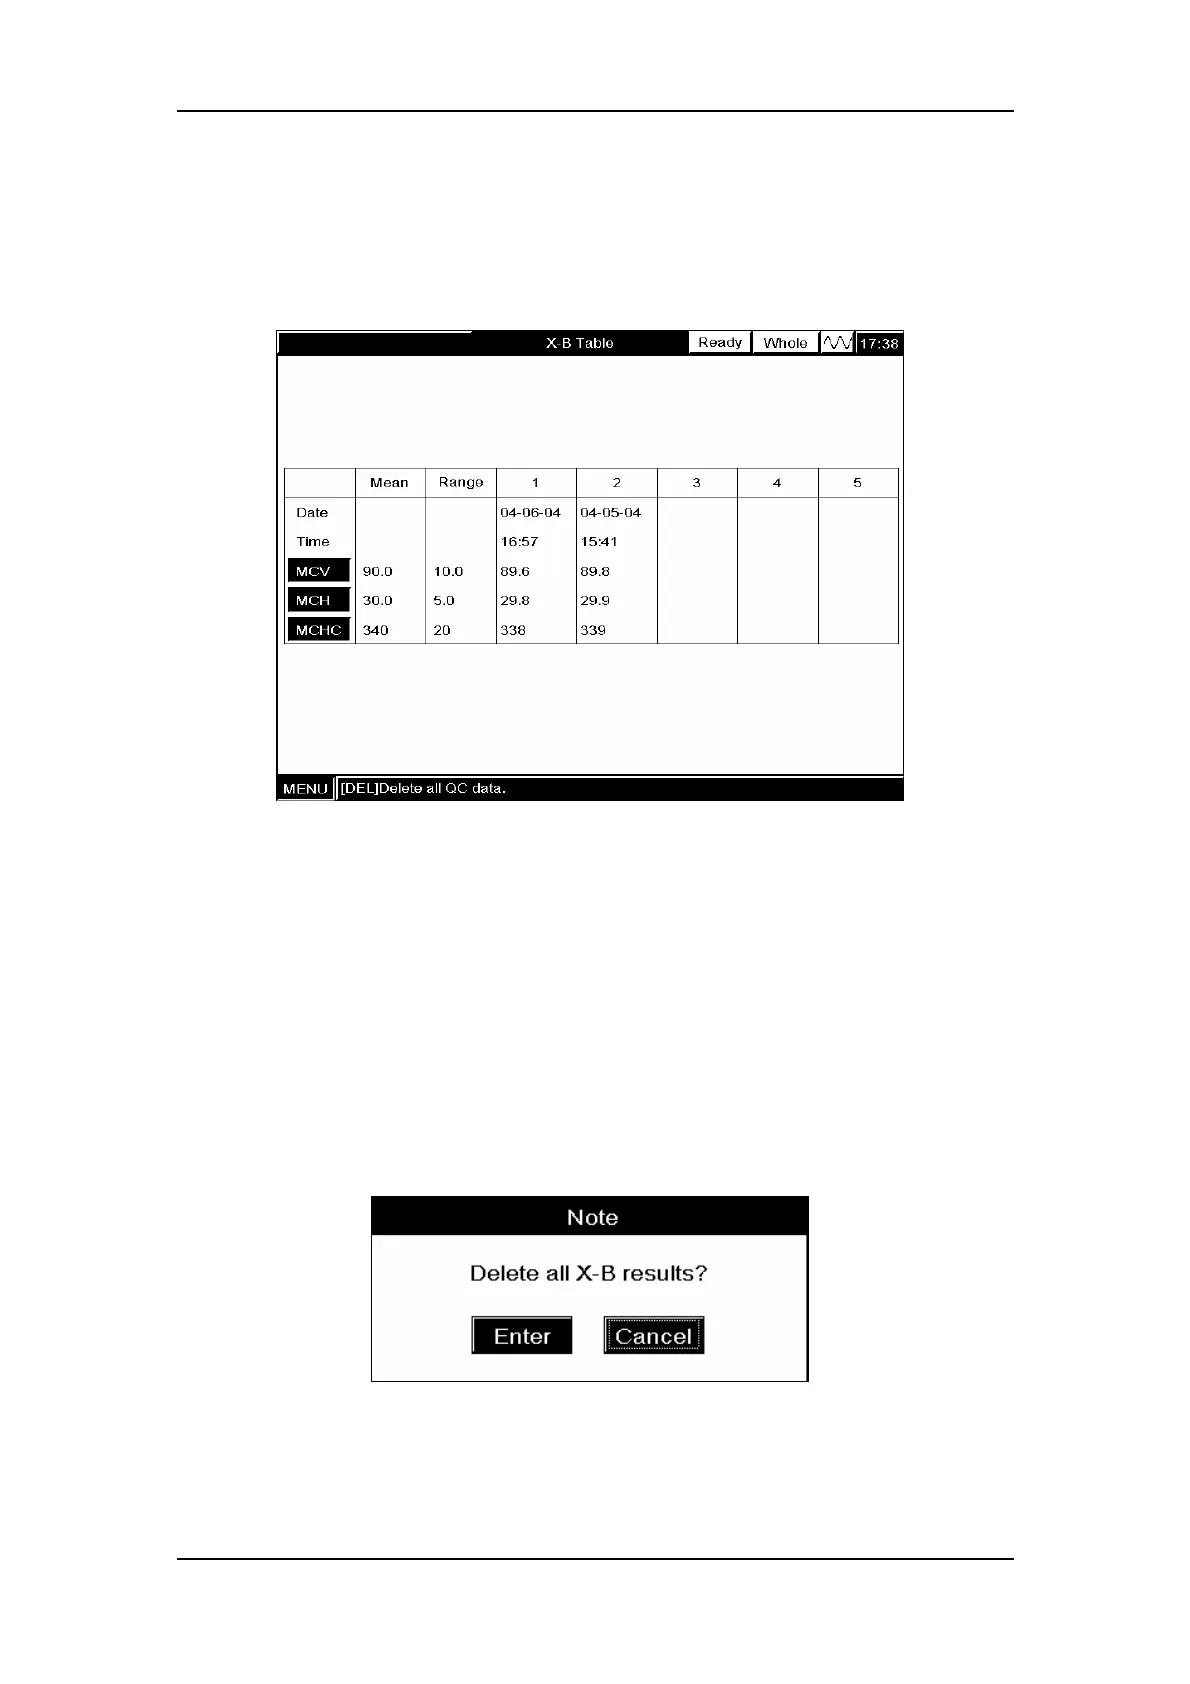
SELECT “Quality Control → X-B Analysis → X-B Table → File 1” (Figure8-58) to enter the
“X-B Table” screen (Figure8-59). Every screen displays 5 results. The parameter value fallen
outside the expected range will be flagged “H” (higher than the upper limit) or “L” (lower than
the lower limit).
Figure8-59 “X-B Table”screen
Browsing X-B analysis results
Press [PgUp] or [PgDn] to review the preceding or following screen.
Deleting X-B analysis results
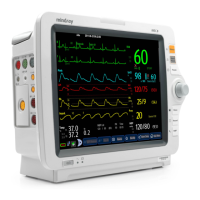
Press [DLE] and a message box will pop up to ask you whether to delete all the X-B analaysis
results saved in this file, as Figure8-60 shows. CLICK “Enter” to confirm the deletion; CLICK
“Cancel” to abort the deletion.
Figure8-60 A message box to confirm the deletion