Using the QC Programs
8-47
2. Check the X-B settings for inappropriate entries;
3. Do the background check. In case of an abnormal background result, refer to Chapter 11
Troubleshooting Your Analyzer for solutions;
4. Run the controls;
5. Check if the analyzer needs to be calibrated.
Browsing X-B analysis results
Press [↑] or [↓] to review the preceding or following screen; press[←] or [→] to review the
preceding or following result. The parameter value of the current point (the one the cursor is
located at) is displayed below the parameter. The location of the current point is displayed in
the “No.” field. The analysis time is displayed in the “Time” field.
Printing X-B graphs
Press [PRINT] to print out the displayed X-B graphs.
Exiting the “X-B Graph” screen
Press [MENU] to exit to the system menu, or press [MAIN] to exit to the “Count” screen.
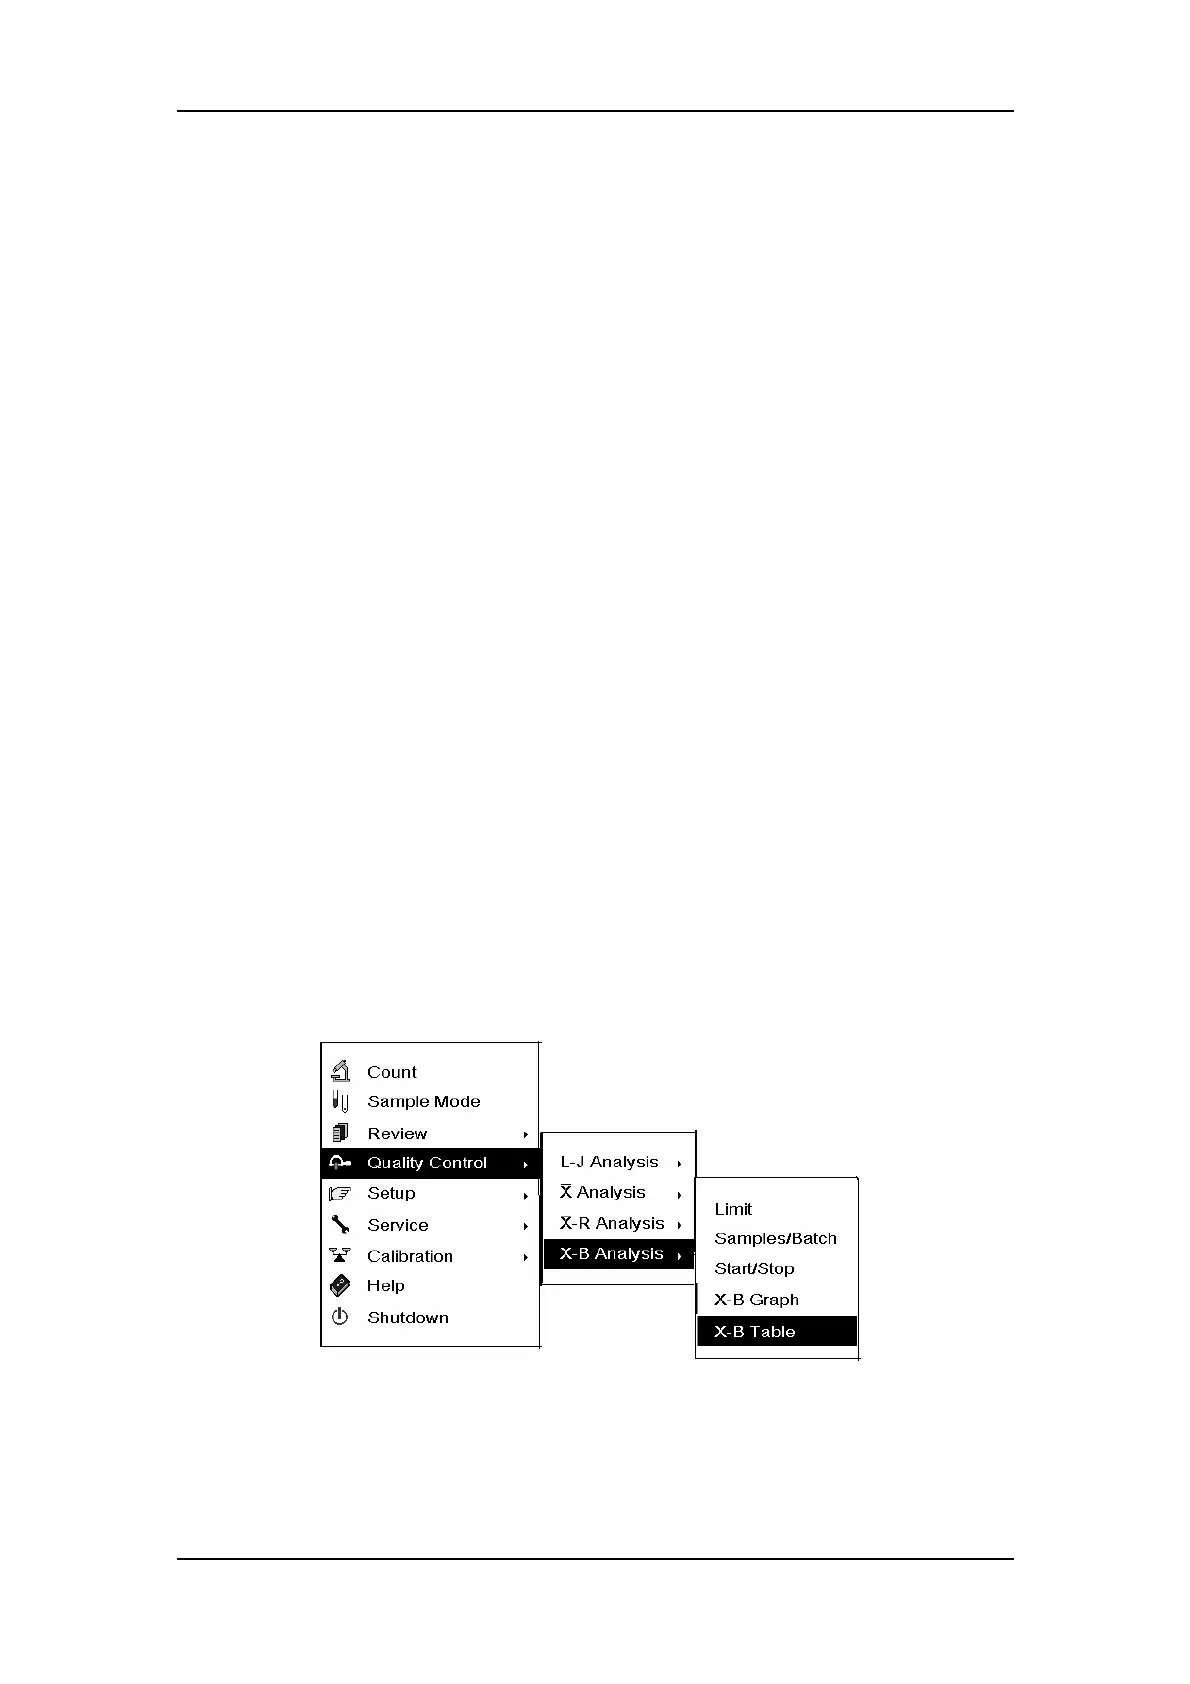
“X-B Table” mode
Entering the “X-B Table”mode
Press [MENU] to enter the system menu.
Figure8-58 System menu