Using the QC Programs
8-46
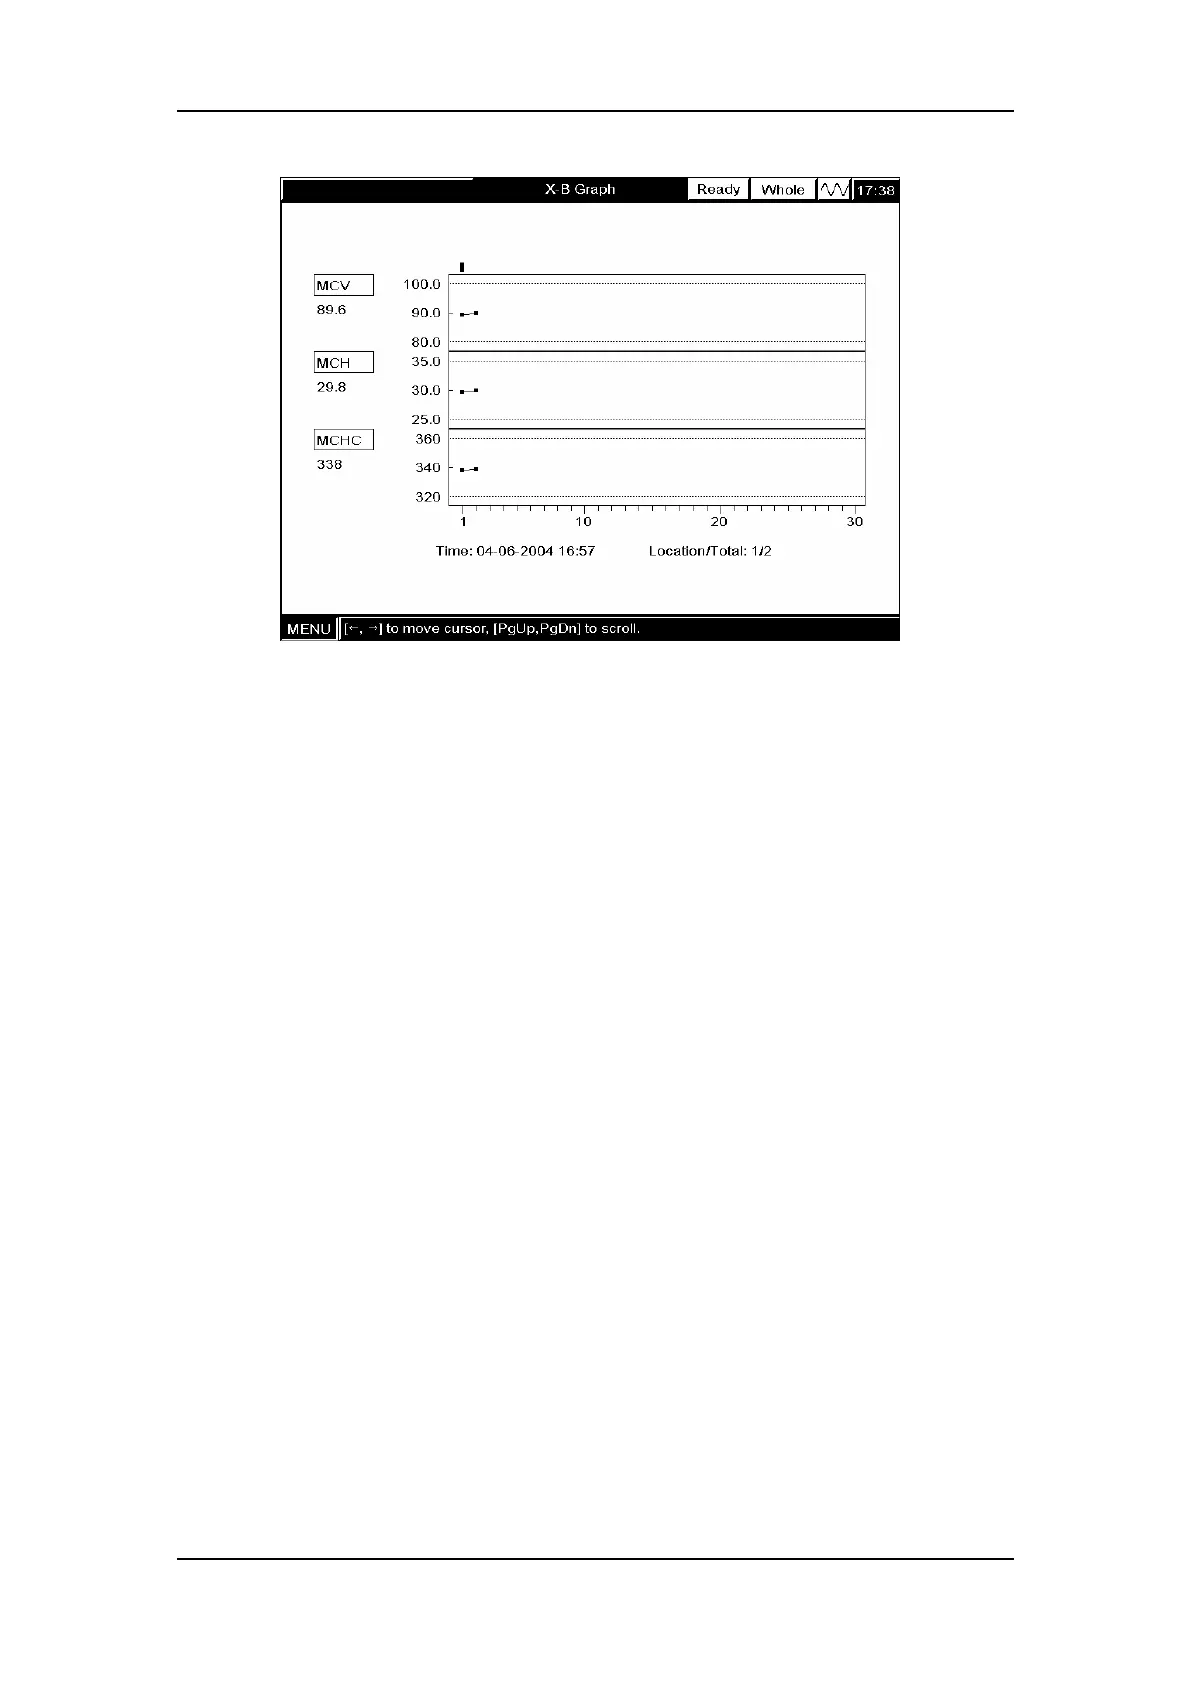
Figure8-57 “X-B Graph” screen
The saved X-B analysis results are sequentially displayed in the X-B graph, the latest on the
utmost left (No.1).
The X-B graph can be interpreted as follows:
The x-coordinate represents the number of X-B analyses performed; the y-coordinate
represents the results of the X-B analyses;
For every parameter, its X-B graph can display maximum 500 points, 30 points per
screen;
For every parameter, the upper dash line represents the expected result + limit;
For every parameter, the upper dash line represents the expected result – limit;
For every parameter (e.g. MCV), the three numbers to the left of the X-BFigure are
defined as follows:
100 – expected result + limit;
90 – expected result;
80 – expected result – limit.
The “■”points fallen between the upper and lower dash lines are within the expected ranges;
The “■”points fallen outside the upper and lower dash lines are out of the expected ranges
If you see any points fallen outside the control range, do the following steps until the problem
is solved. If all the steps have failed, contact Mindray customer service department or your
local distributor for assistance.
1. Check the upper left corner of the screen for error messages. Refer to Chapter 11
Troubleshooting Your Analyzer for solutions to any displayed error messages;