Using the QC Programs
8-45
8.5.4 Performing X-B Analysis
Once enabled, the X-B analysis will be performed on batches of patient samples of the
defined number (20 - 200). The analysis results will be displayed on the X-B graph as well as
the X-B table.
8.5.5 Reviewing X-B Analysis Results
You can review the X-B analysis results in either the “X-B Graph” mode or “X-B Table” mode.
“X-B Graph” mode
Entering the “X-B Graph” screen
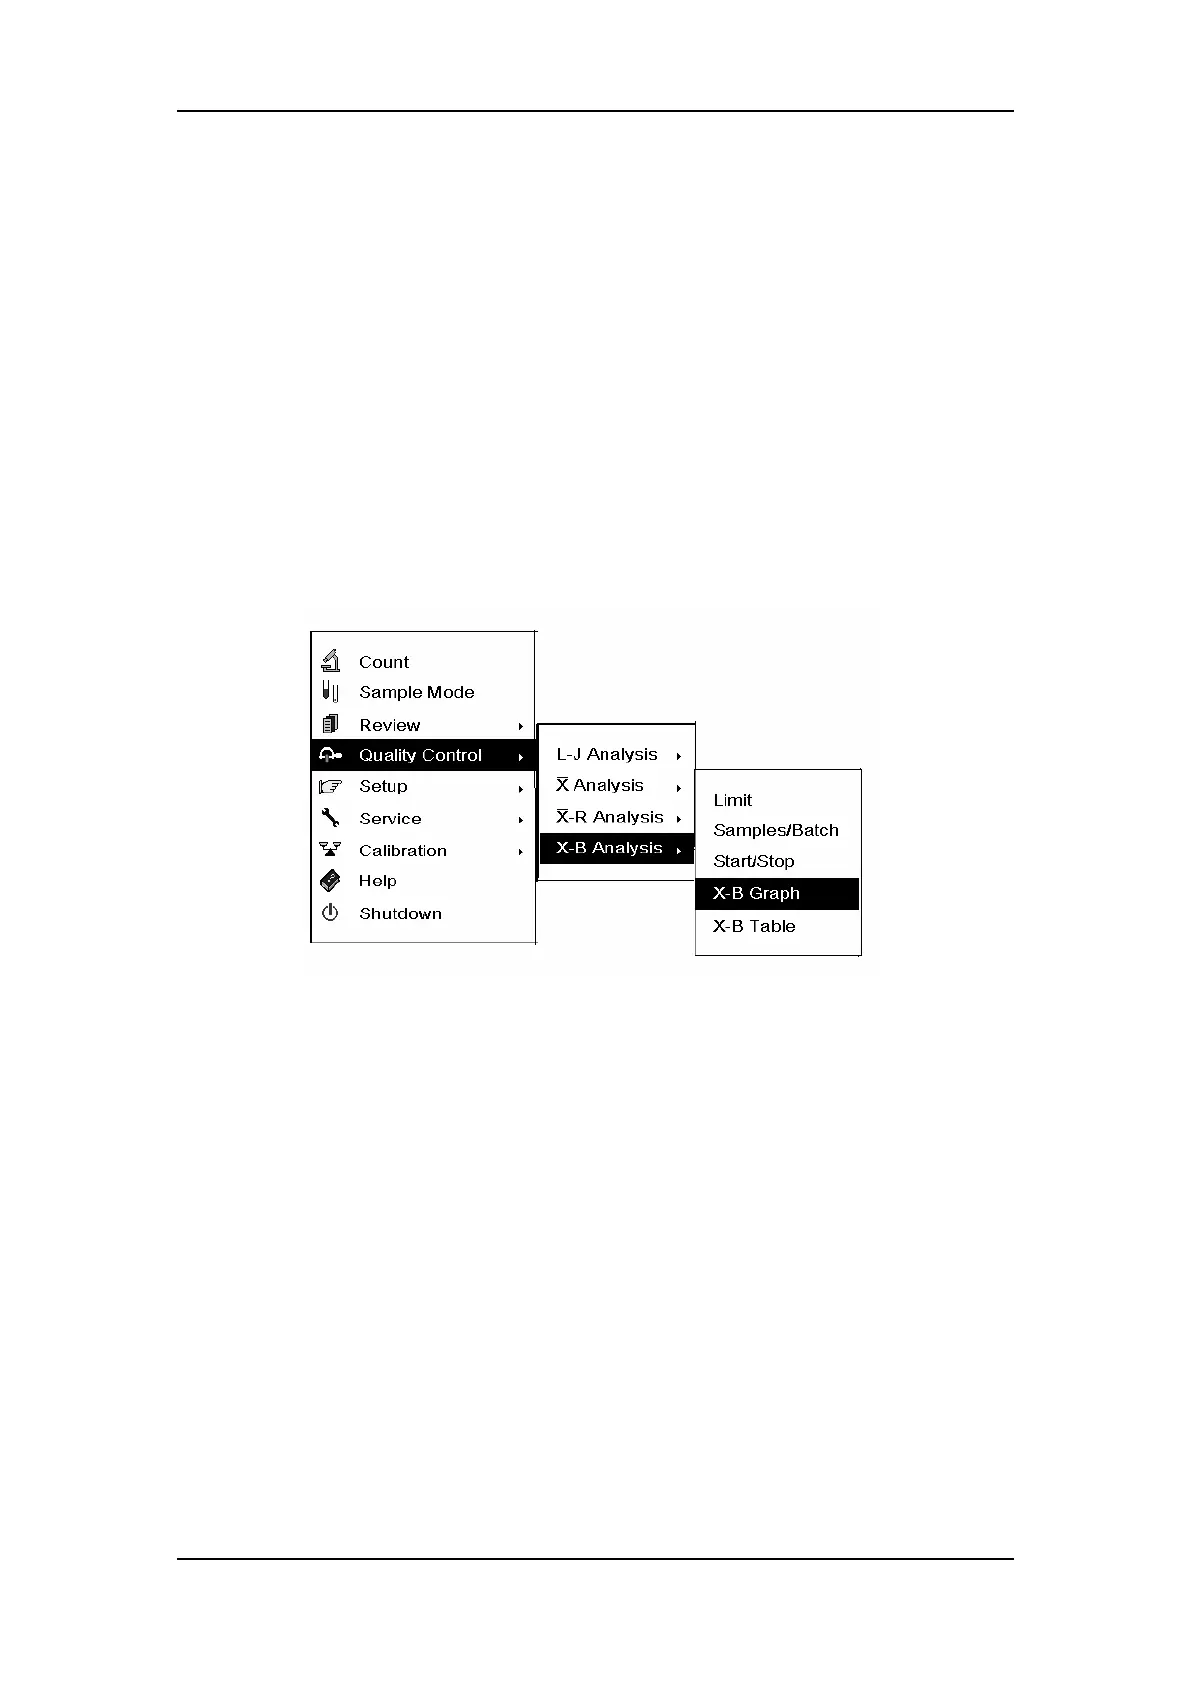
Press [MENU] to enter the system menu.
Figure8-56 System menu
SELECT “Quality Control → X-B Analysis → X-B Graph” (Figure8-56) to enter the “X-B
Graph” screen (Figure8-57).