Network Maintenance
61
N600 Wireless Dual Band Gigabit VDSL2 Modem Router DGND3800B
Show Statistics Button
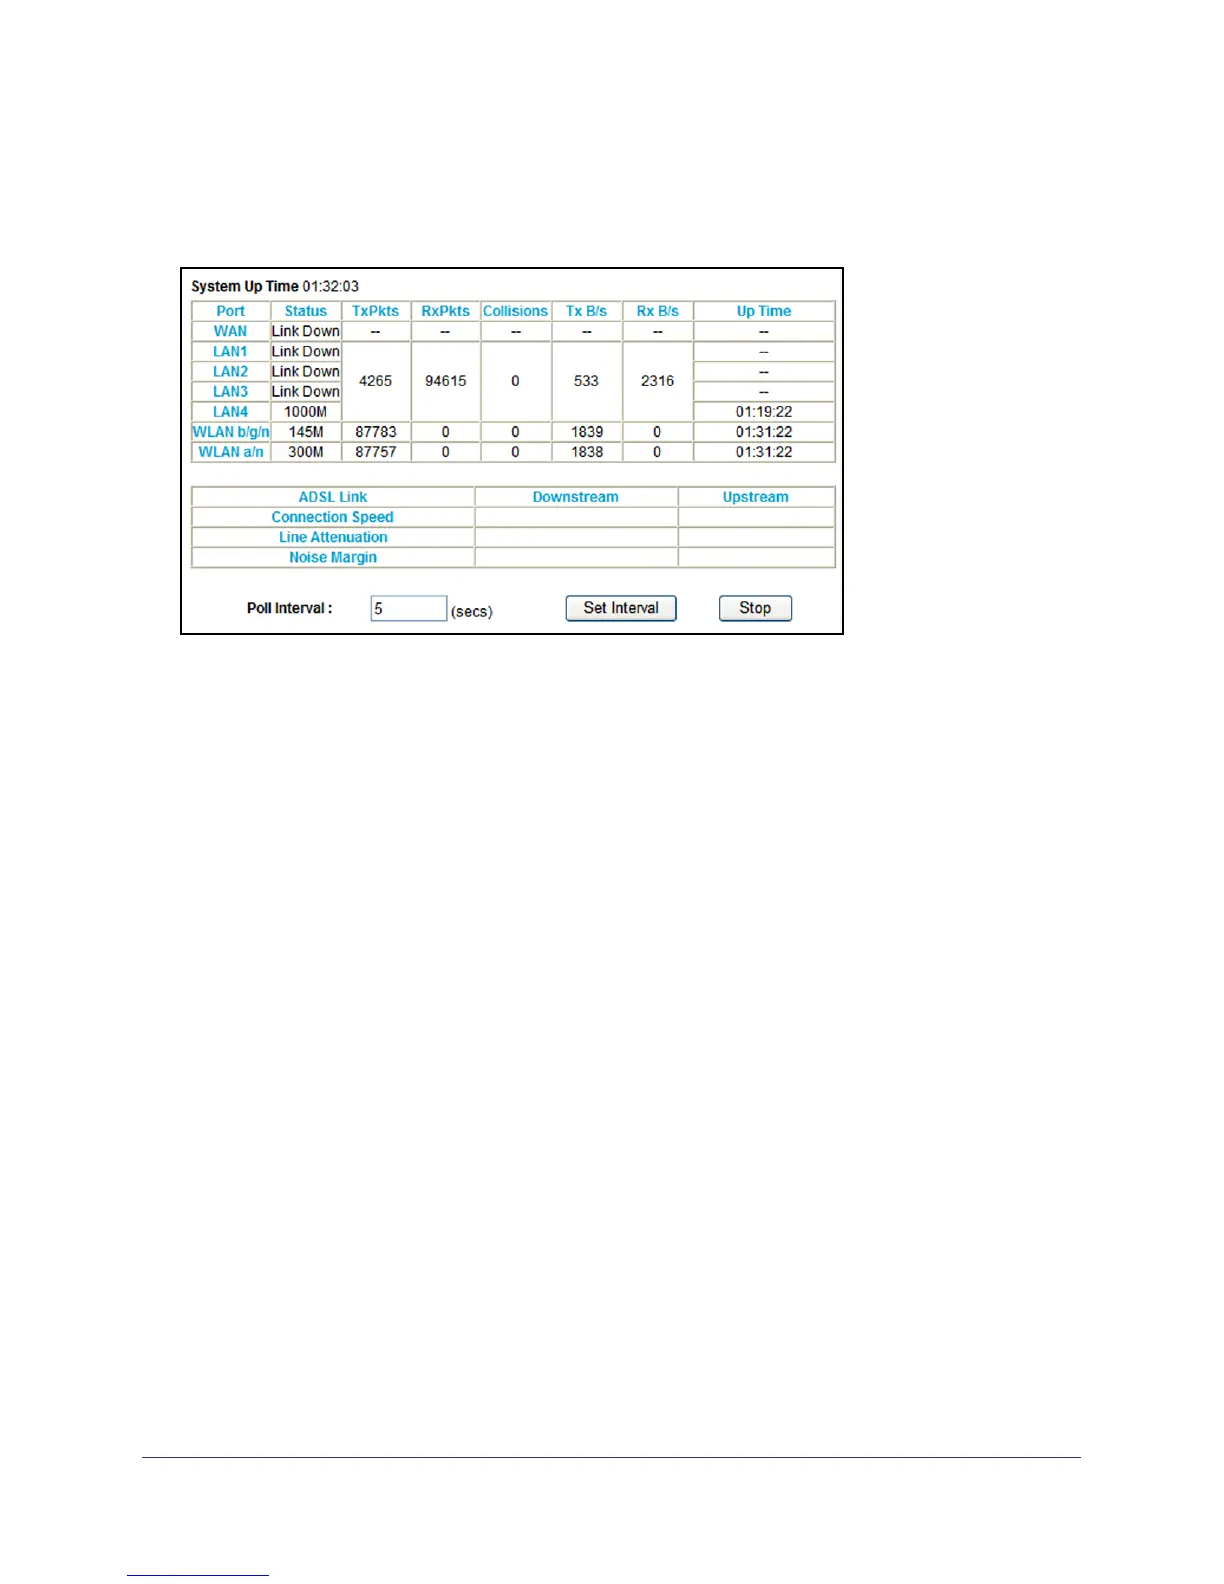
Click the Show Statistics button on the Router Status screen to display a screen similar to
this:
Figure 10. Router statistics screen
• Port. The statistics for the WAN (Internet), LAN (local), and wireless LAN (WLAN) ports.
For each port, the screen displays the following:
- Status. The link status of the port.
- TxPkts. The number of packets transmitted since reset or manual clear.
- RxPkts. The number of packets received since reset or manual clear.
- Collisions. The number of collisions since reset or manual clear.
- Tx B/s. The current line utilization—percentage of current bandwidth used.
- Rx B/s. The average line utilization.
- Up Time. The time elapsed since the last power cycle or reset.
• ADSL Link Downstream or Upstream. The statistics for the upstream and downstream
link. These statistics are of interest to your technical support representative if you have
problems obtaining or maintaining a connection.
• Connection Speed. Typically, the downstream speed is faster than the upstream speed.
• Line Attenuation. The line attenuation increases the farther you are physically located
from your ISP’s facilities.
• Noise Margin. The signal-to-noise ratio, which is a measure of the quality of the signal on
the line.
• Poll Interval. The interval at which the statistics are updated in this window. Click the
Stop button to freeze the display.

 Loading...