Northstar Explorer 650 Installation and Operation Manual42
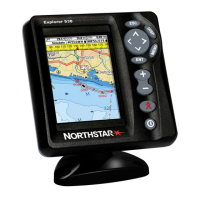
9-5 Sonar A-Scope display
The display shows the sonar history on the
left and the A-Scope display on the right. The
A-Scope shows:
A, B, C The strengths of echoes being received
now from different depths - the longer
the horizontal line the stronger the signal:
A Unwanted noise echoes.
B Echoes from fish and the bottom
C The strongest echo, usually from the
bottom
D A vertical line showing the threshold, the
weakest echo to display on the sonar history
E A vertical line showing the gain setting;
echoes above this strength will display as the
maximum signal strength
Use the A-Scope while adjusting the gain and
threshold settings manually (see section 8-6).
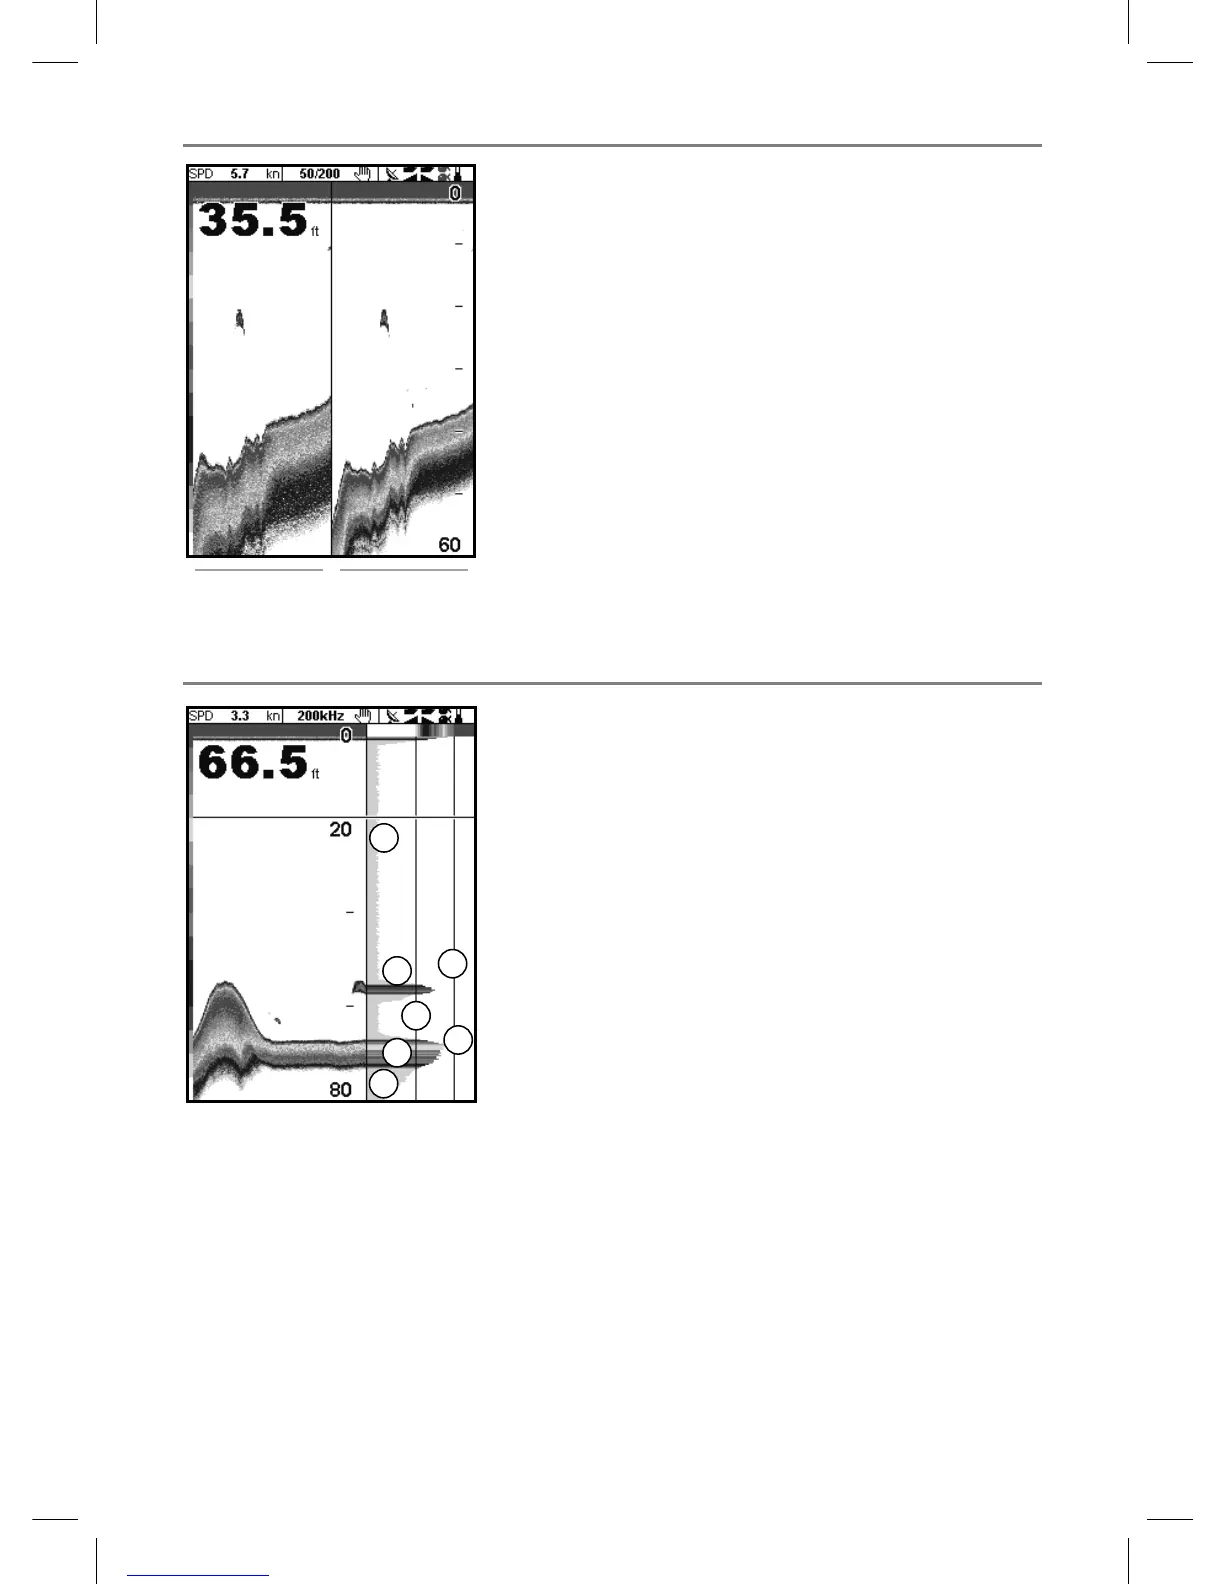
9-4 Sonar 50/200 display
The display shows:
A the 50 kHz sonar history on the left
B the 200 kHz sonar history on the right.
Gain can be set independently for each
frequency (see section 8-6). Range applies to
both frequencies (see section 8-5).
A
B
A
C
E
D
A
B
B