42
3.5.3 See measurements
This function displays the result of the selected measurement. If acquisition is not yet performed, it displays directly
the live values.
There are 3 types of display:
Overall level
Spectrum
Time-wave
Each one is available for 1, 2, 3 or 4 channels.
For spectrum and time-wave, a first click on a curve selects it as the current one, a 2
nd
click sets a cursor. The
cursor is automatically positioned on the maximum of the curve around the click area. Then it can be moved with
functions and .
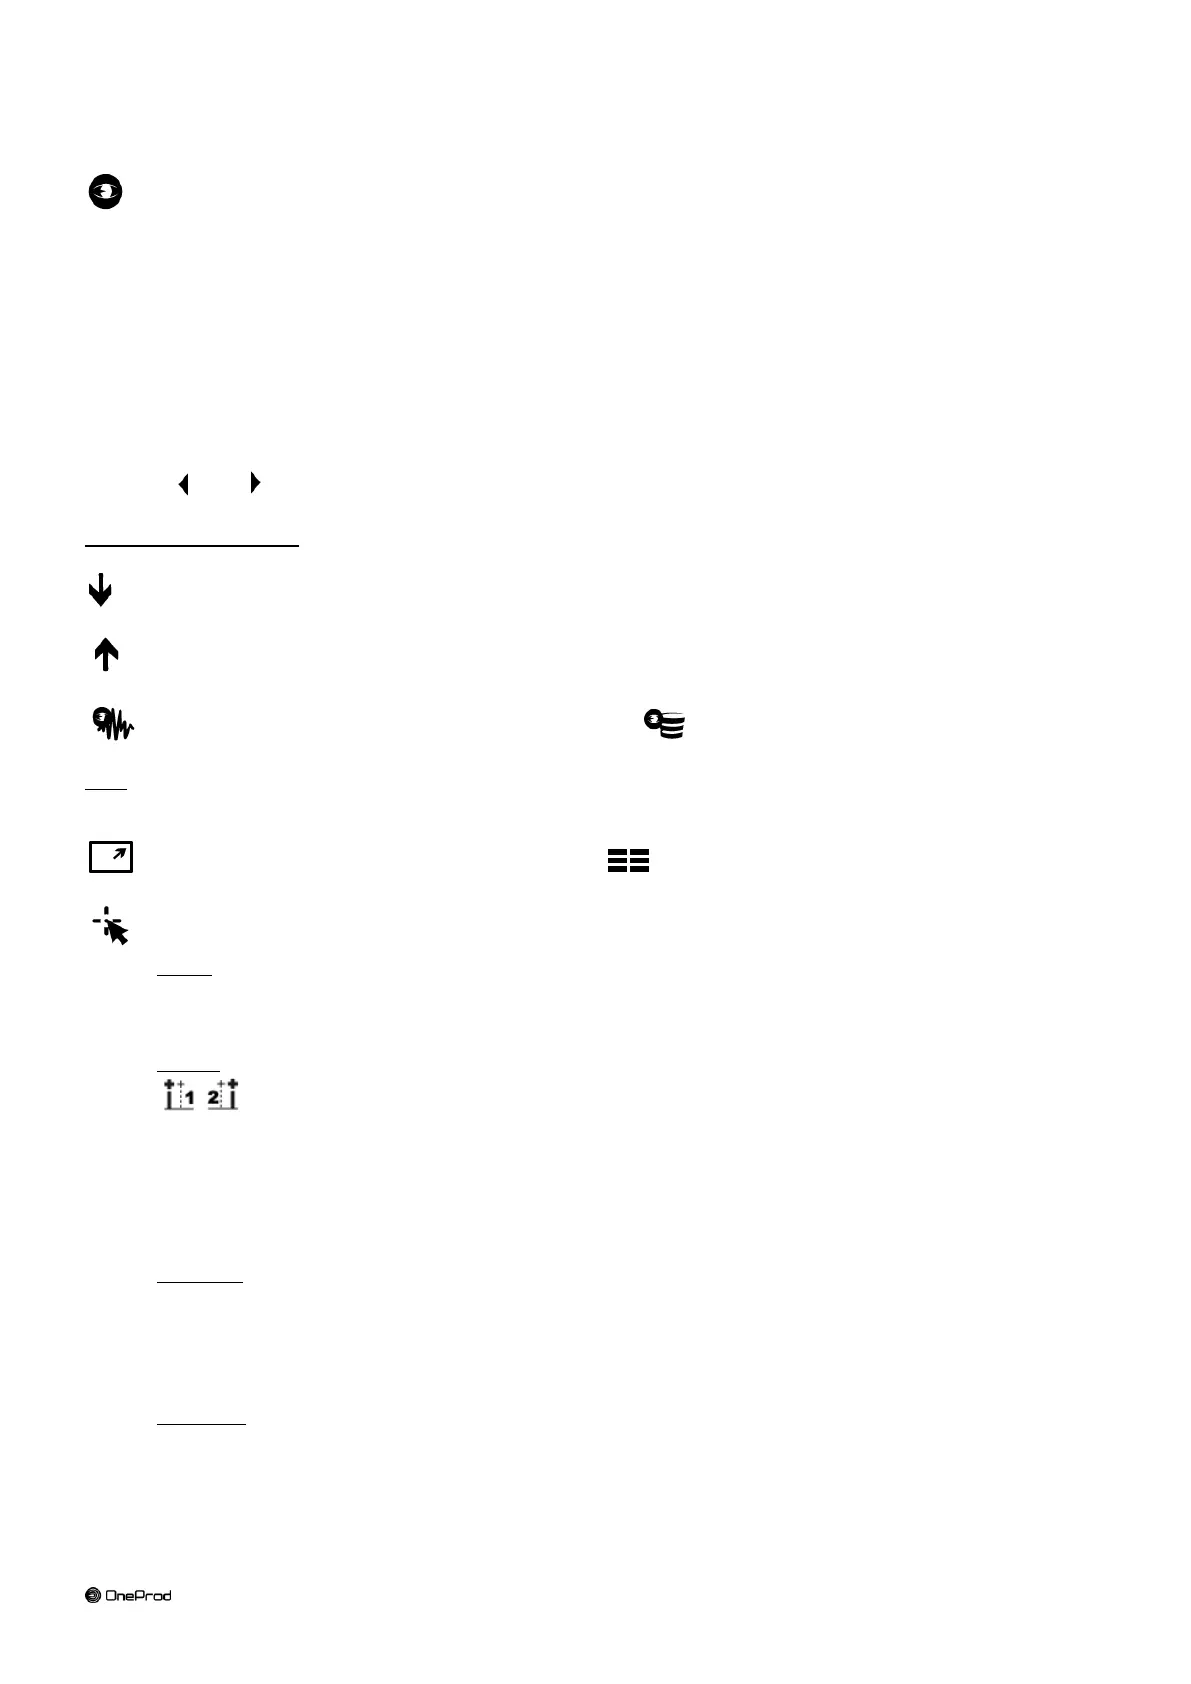
Functions of the screen:
Next measurement: go directly to the next measurement of the measurement list screen.
Previous measurement: go directly to the previous measurement of the measurement list screen.
Live measurement: switch to live measurement mode. return to stored mode. Live mode is directly
selected if there is no acquisition stored.
Note: live measurement uses the sensitivity of the measurement itself and not the one of the 1
st
measurement of
the group which is used for group acquisition
Full screen: display the selected curve full screen. return to to the multi curve display.
Cursor type selection
Single (spectrum and time-wave)
Indications:
At the bottom: frequency
At the top: amplitude
Double (spectrum and time-wave)
Select active cursor
Indications:
At the bottom: the distance between the 2 cursors
At the top:
o Spectrum: RMS or equivalent value between the 2 cursors
o Time-wave: amplitude
Harmonic (spectrum only)
The fundamental cursor is automatically adjusted on the true frequency of a maximun by interpolation.
Harmonic frequencies in coincindence with a maximum are marked by a sign.
Indications:
At the bottom: fundamental frequency
At the top: amplitude at the fundamental frequency
Side band (spectrum only)
The central cursor and the first side band cursor are automatically adjusted on the true frequency of a
maximun by interpolation. Side band frequencies in coincindence with a maximum are marked by a sign.