Main and aux. parameters.
Value mode gives single line numerical pre-
sentation of individual results, where the main
parameter is displayed in large characters with
full resolution together with a number of
auxiliary parameters in small characters with
limited resolution.
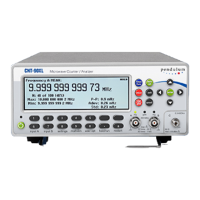
If Limit Behavior is set to Alarm and Limit
Mode is set to Range you can visualize the de-
viation of your measurements in relation to the
set limits. The numerical readout is now com-
bined with a traditional analog pointer-type in-
strument, where the current value is
represent
ed by a "smiley". The limits are
presented as numerical values below the main
parameter, and their positions are marked with
vertical bars labelled LL (lower limit) and UL
(upper limit) on the autoscaled graph.
If one of the limits has been exceeded, the
limit indicator at the to
p of the display will be
flashing. In case the current measurement is
out of the visible graph area, it is indicated by
means of a left or a right arrowhead.
If you want to treat a number of measurements
with statistical methods, this is the key to
operate. There are three display modes
available by toggling the key:
Statistics presented numerically.
In this mode the statistical information is dis-
played as numerical data containing the fol-
lowing elements:
P-P: peak-to-peak deviation
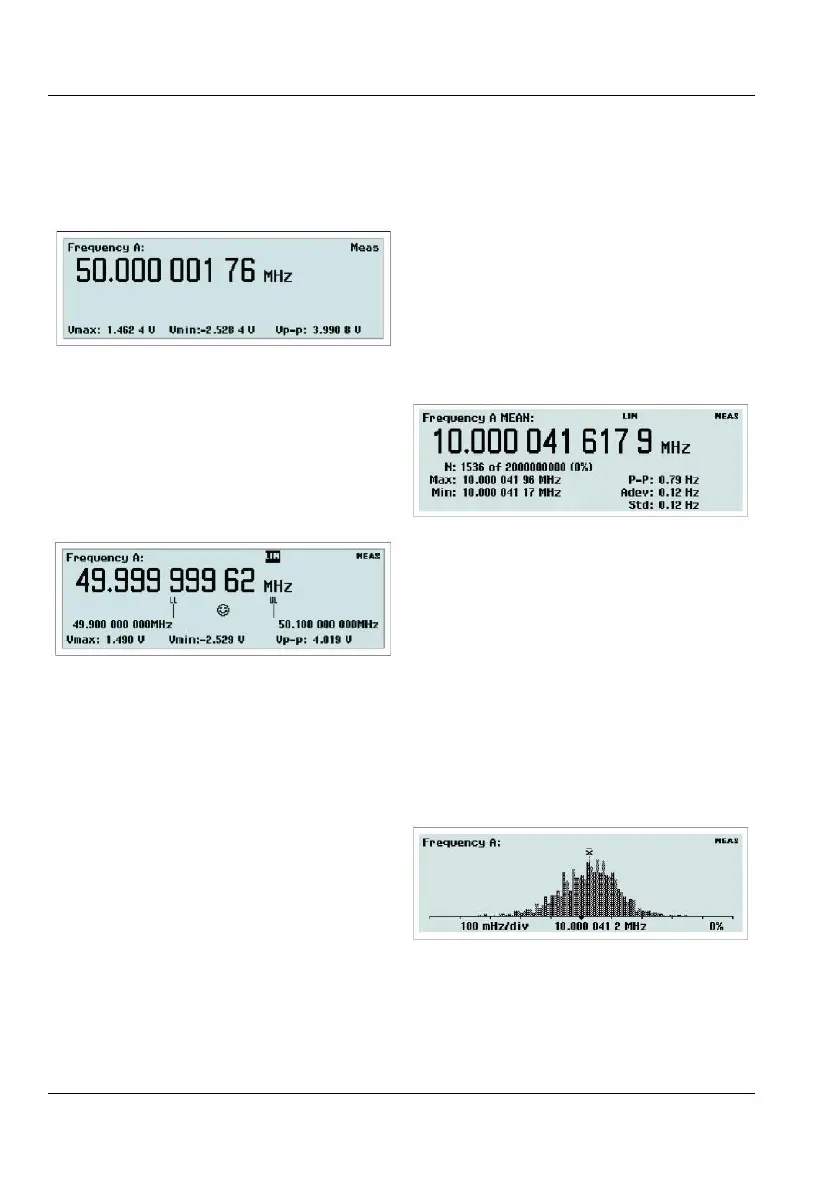
Statistics presented as a histogram.
The bins in the histogram are always
autoscaled based on the measured data. Limits,
if enabled, and center of graph are shown as
vertical dotted lines. Data outside the limits are
not used for autoscaling but are replaced by an
USER MANUAL ● CNT 9x Series ● Rev.22 February 2020
2-9