By changing the constant K you can scale the
result instead.
Use the expression X/M-1 if you want the re-
sult to be displayed as a relative deviation.
Statistics
Statistics can be applied to all
measuring functions and can also be applied
to the result from Mathematics.
The available statistics functions are as fol-
lows:
X MAX: Displays the maximum value within a
sampled population of N x
i
-values.
X MIN: Displays the minimum value within a
sampled population of N x
i
-values.
XP-P: Displays the peak-to-peak deviation
within a sampled population of N
x
i
values.
MEAN: Displays the arithmetic mean value
(x
of a sampled population of N x
i
values and is calculated as:
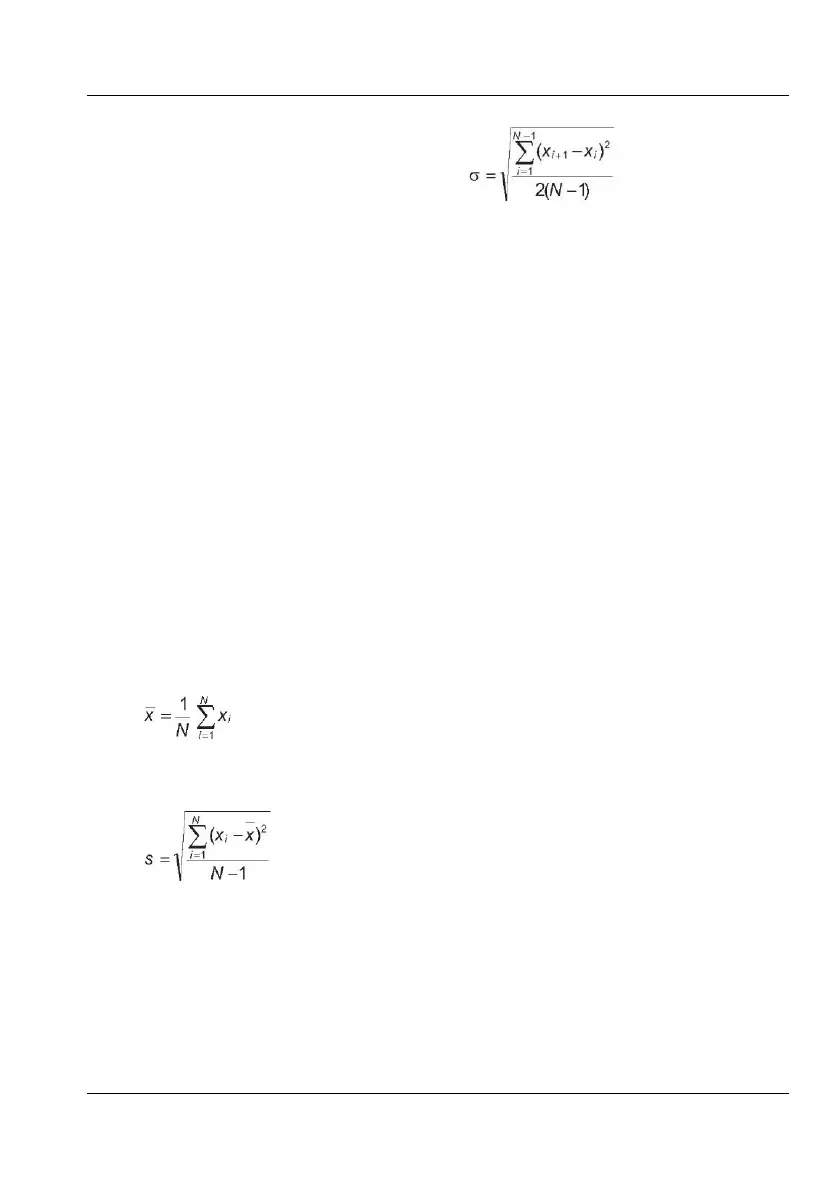
ST DEV: Displays the standard deviation (s) o
a sampled population of N x
i
-values
and is calculated as:
It is defined as the square root of the
variance.
A DEV: Displays the Allan deviation (σ) of a
sampled population of N x
i
-values and
is calculated as:
It is defined as the square root of the
Allan variance.
The number N in the expressions above can
assume any value between 2 and 2*10
9
.
Allan Deviation vs. Standard
Deviation
The Allan Deviation is a statistic used for
characterizing short-term instability (e.g.
caused by jitter and flutter) by means of sam-
ples (measurements) taken at short inte
rvals.
The fundamental idea is to eliminate the
influence of long-term drift due to aging,
temperature or wander. This is done by
making consecutive comparisons of adjacent
samples.
The Standard Deviation, which is probably a
more familiar statistic, considers the effects
of all types of deviation, as all samples in the
population are compared with the total mean
value.
As you can
see, both the Allan Deviation and
the Standard Deviation are expressed in the
same units as the main parameter, e.g. Hz or
s.
Press No. of samples and enter a new
value by means of the numerical keys or
the
UP/DOWN arrow keys, if you want to
change the default value of 100.
Proceed in the same way for No. of bins
if you want to present the measurement
results graphically in a histogram.
USER MANUAL ● CNT 9x Series ● Rev.22 February 2020