37
Customer Support 1-855-IMI-POGO (464-7646) • www.presspogo.com
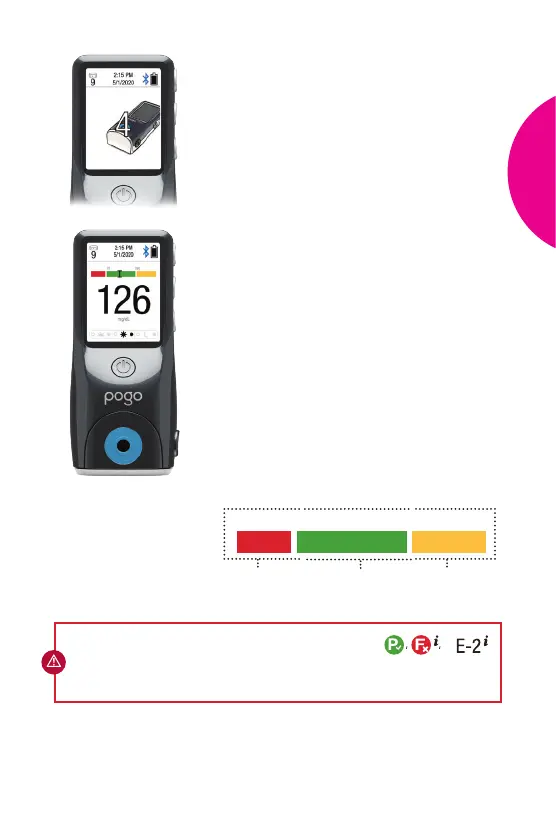
Glucose Result
Quick Graph
In Range
Out of Range
(Low)
Out of Range
(High)
Countdown
Results
• You can view result aer a 4-second
countdown.
• Aer reviewing result, you can now
turn o the meter by pressing the
power button or allow it to shut o
automatically aer 30 seconds.
• Your test results are automatically stored
in meter memory, added to averages
and can be marked as pre- or post-meal
results (See Pre- or Post-Meal Marking
on page 44).
• The Quick Graph (example below)
appears with your result to instantly let
you know if your results are in range.
• The preset glucose range on the Quick
Graph is 70 – 180 mg/dL. If needed, you
can adjust the range in the Set-Up Menu
(See Quick Graph Settings on page 58).
70
180
CAUTION: If during testing your results are displayed as a
redo the test. If this continues, call Intuity Medical Customer Support at
1-855-IMI-POGO (464-7646).
or
TEST
YOUR
BLOOD