2-22 HSB Series Color LCD Display
Moving Around the
Chart
(Section 7.7, Chart Set Up Parameters),
FIND SHIP
also synchronises the radar
and chart images as follows:
• The chart is redrawn so that its center position matches that of the radar dis-
play.
• The radar is redrawn to the scale and heading mode of the chart.
Note: Depending on the topology of the coastline, the radar returns may not
relate to the charted shoreline, the radar image will therefore be different to
the chart display. For example, a gently sloping beach with a cliff several hun-
dred metres beyond the charted coastline, the cliff is not shown on the chart
but will be displayed on the radar image.
Changing the Chart Scale
The
RANGE
key allows you to change the chart scale so that you can see a
smaller or larger area on the screen.
Plotter mode is available to allow you to zoom into a smaller area, even when
no chart data is available for that scale. Section 7.7 describes how to set plotter
mode on/off.
You can change the chart scale for two purposes:
• To see either more detail (of a smaller area) or a larger area (in less detail)
on the screen.
• To move the display to another area of the chart, by zooming out to a small
scale chart, then zooming in on another position centered on the cursor.
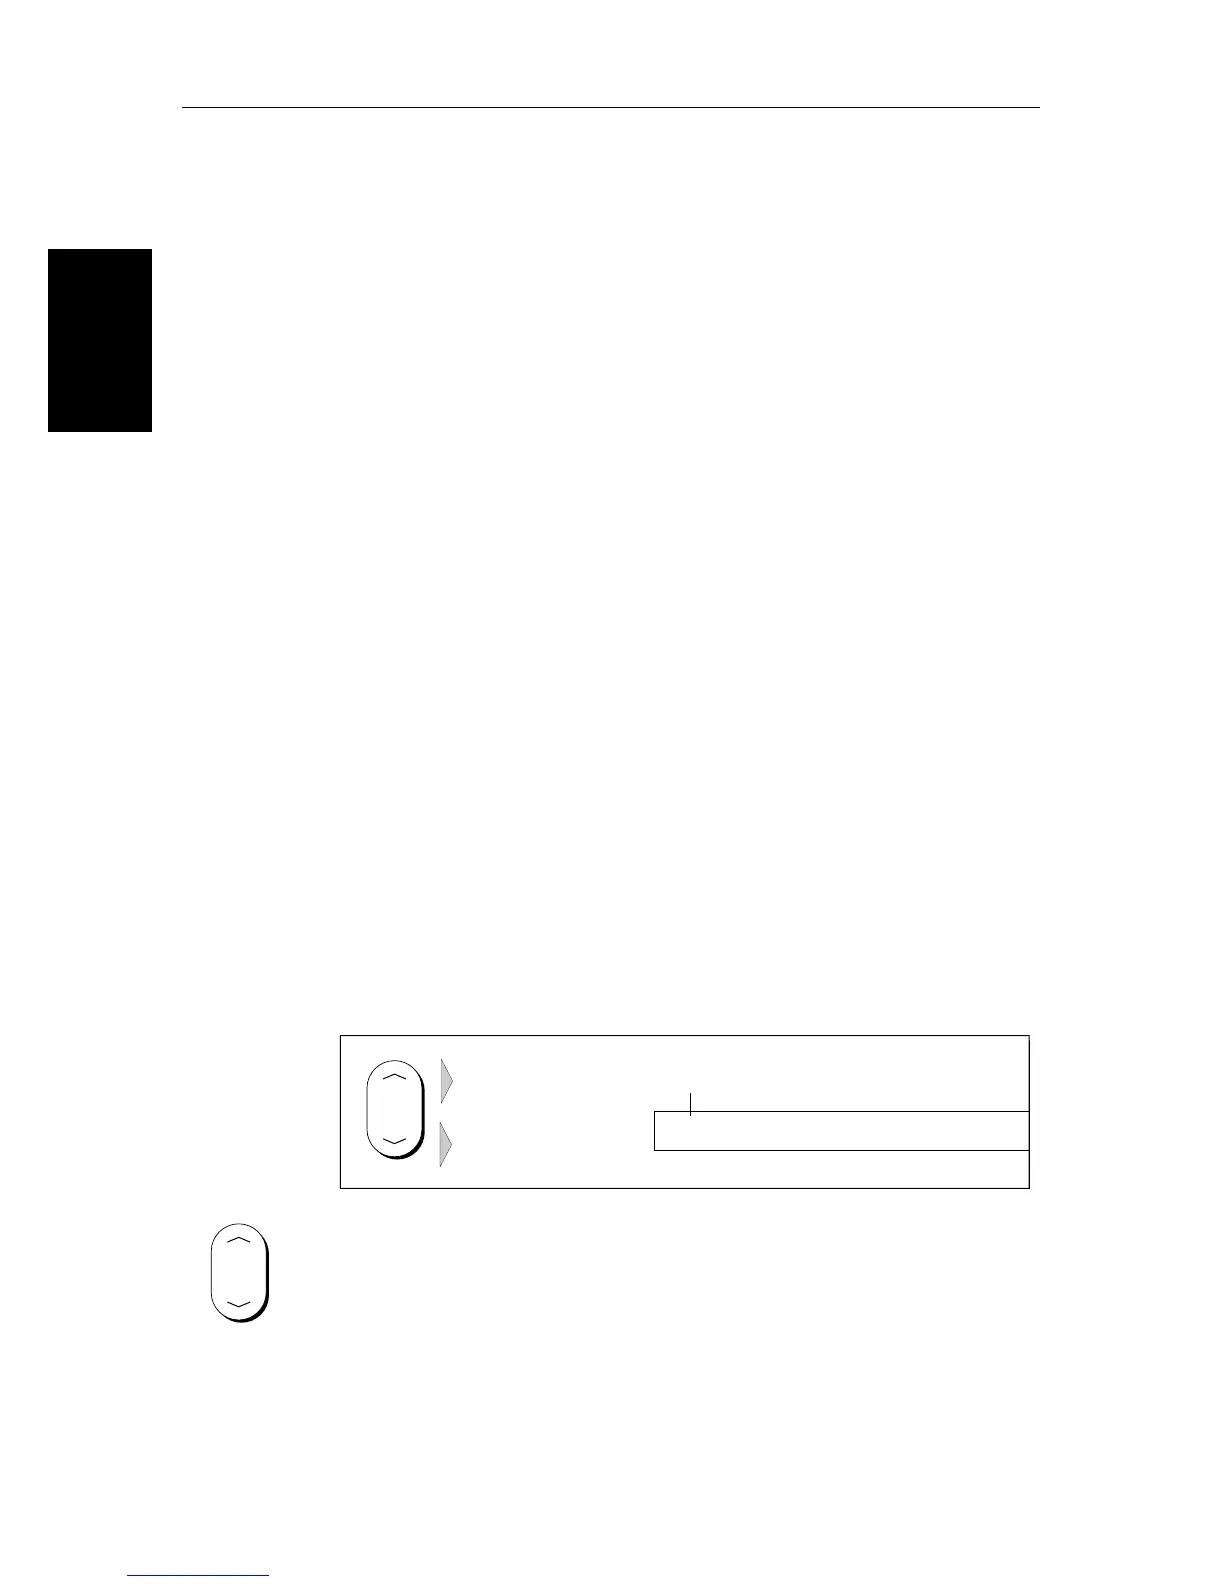
Each time you press the
RANGE
key, the chart scale changes to the next
available setting. The status bar indicates the distance from top to bottom of
the screen, in nautical miles.
➤ To change the scale quickly, press and hold the required arrow on the
RANGE
key.
The distance indicator at the left-hand end of the status bar is updated
whenever you change the chart scale.
RANGE
D4175_1
Increases the
chart distance
Decreases the
chart distance
Vertical distance
displayed on chart
Status Bar
6nm
CSR 50 45'980N
POS 001 01'490W
RANGE