Introduction
4
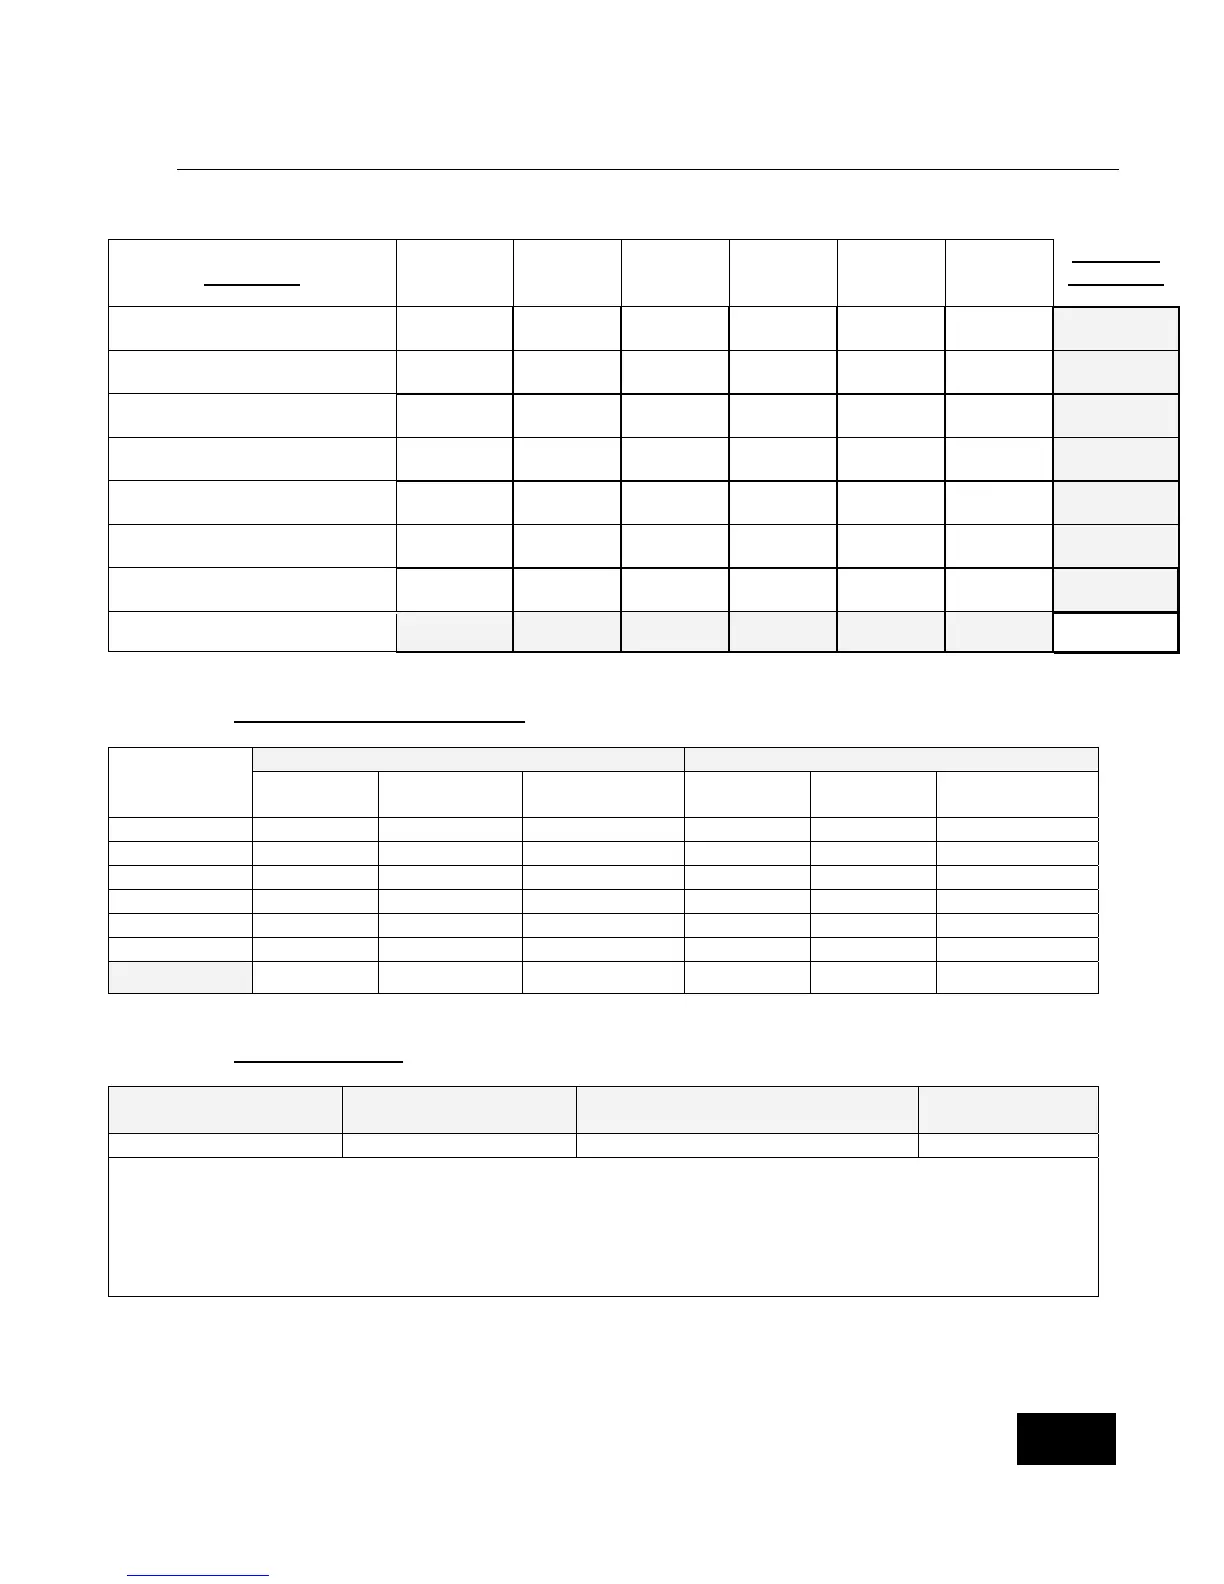
Diagnosis Summary
Diagnosis
Site # 1
Site #2
Site #3
Site #4
Site #5
Site #6
Totals by
Diagnosis
Prematurity 10 0 0 7 13 0
30
RDS, Resp. Failure, HMD 3 0 0 3 5 0
11
ALTE, Apnea, AOI, AOP 8 2 8 6 5 4
33
Bronchiolitis, Pneumonia, RSV 0 3 0 1 0 6
10
Gastro-Esophageal Reflux 0 0 0 2 1 1
4
Broncho-Pulmonary Dysplasia 0 0 0 2 2 0
4
Other 5 2 5 10 10 2
34
Totals by Site 26 7 13 31 36 13 126
Results for Both Monitors by Site
SmartMonitor SmartMonitor 2
Study Site
Apnea
with Alarm
No Apnea
with Alarm
Apnea
without Alarm
Apnea
with Alarm
No Apnea
with Alarm
Apnea
without Alarm
Site #1
25 21 20 28 21 17
Site #2
2 2 3 2 2 3
Site #3
3 12 6 3 13 6
Site #4
10 21 10 11 11 9
Site #5
21 19 25 18 19 28
Site #6
7 22 10 11 19 6
Totals
68 97 74 73 85 69
Analysis of Results
SmartMonitor
Apnea with Alarm
SmartMonitor 2
Apnea with Alarm
Difference
(SmartMonitor 2 – SmartMonitor)
% Difference
68 73 5 6.8
The sensitivity for SmartMonitor is 100*68/142 = 47.89% with 95% confidence limits (39.44%, 56.42%). The
positive predictive value for SmartMonitor is 100*68/165 = 41.21% with exact 95% confidence limits (33.62%,
49.13%).
The sensitivity for SmartMonitor 2 is 100*73/142 = 51.41% with 95% confidence limits (38.25%, 54.30%).
The positive predictive value of Smart Monitor 2 is 100*73/158 = 46.20% with exact 95% confidence limits
(38.25%, 54.30%).