110
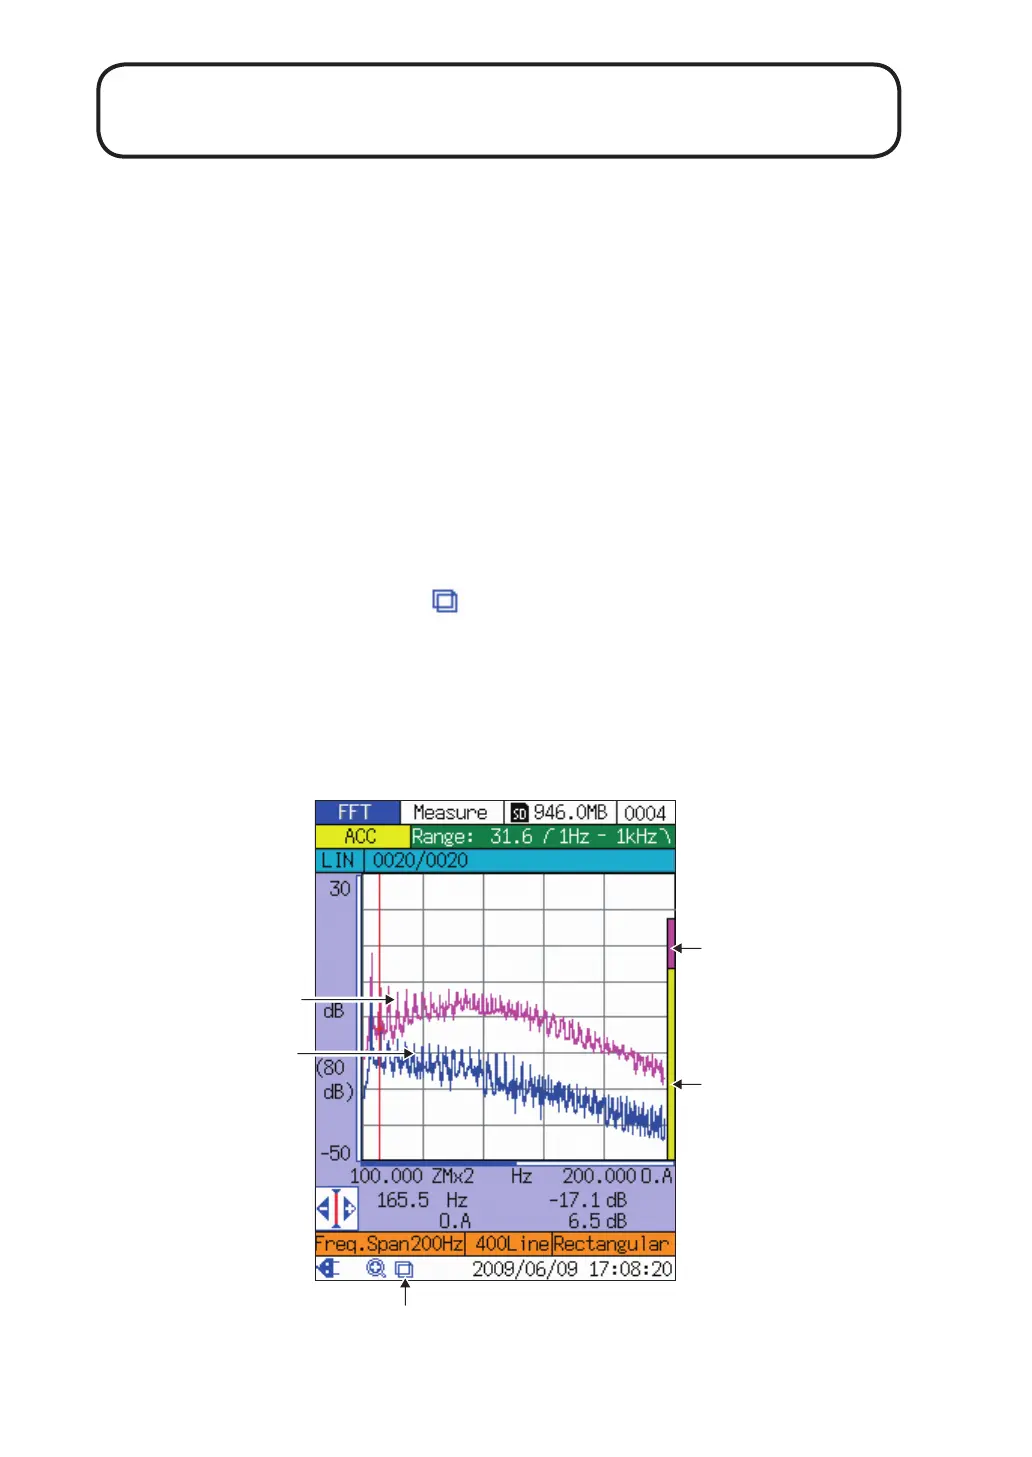
Overlay Display
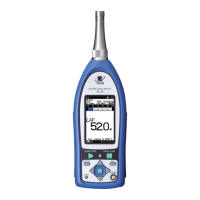
In FFT mode (graph display), the screen for displaying stored data can be shown
together with the current measurement screen in an overlay con guration. This
makes comparison of data easier.
Activating the overlay display
1. At the [Display] menu screen, set the [Overlapping] item to [On].
2. At the measurement screen, store the data that you want to use for
the overlay display (see page 75).
3. Recall the data stored in step 2 (see pages 79 to 80).
4. Press the STORE key.
The background of the store address indication becomes orange, and
the overlay symbol
is shown on the status bar. The LED indicator
ashes in green.
5. Press the START/STOP key to return to the measurement screen.
The stored data and the current data are now shown together in an
overlay con guration. Both the line chart and bar graph for the stored
data are shown in green.
Overlay symbol
Stored data (purple)
Current value (yellow)
Current value (blue)
Stored data (purple)
Overlay display example
 Loading...