157
Speci cations
Data display content
Vibration meter mode:
Acceleration, velocity, displacement, acceleration peak
value, acceleration crest factor
Acceleration, velocity, or displacement bar graph
FFT mode: Spectrum graph display or list display
Graph display:
X axis: Entire spectrum data are represented by
201 display points, overall value excluding
DC components indicated by bar graph
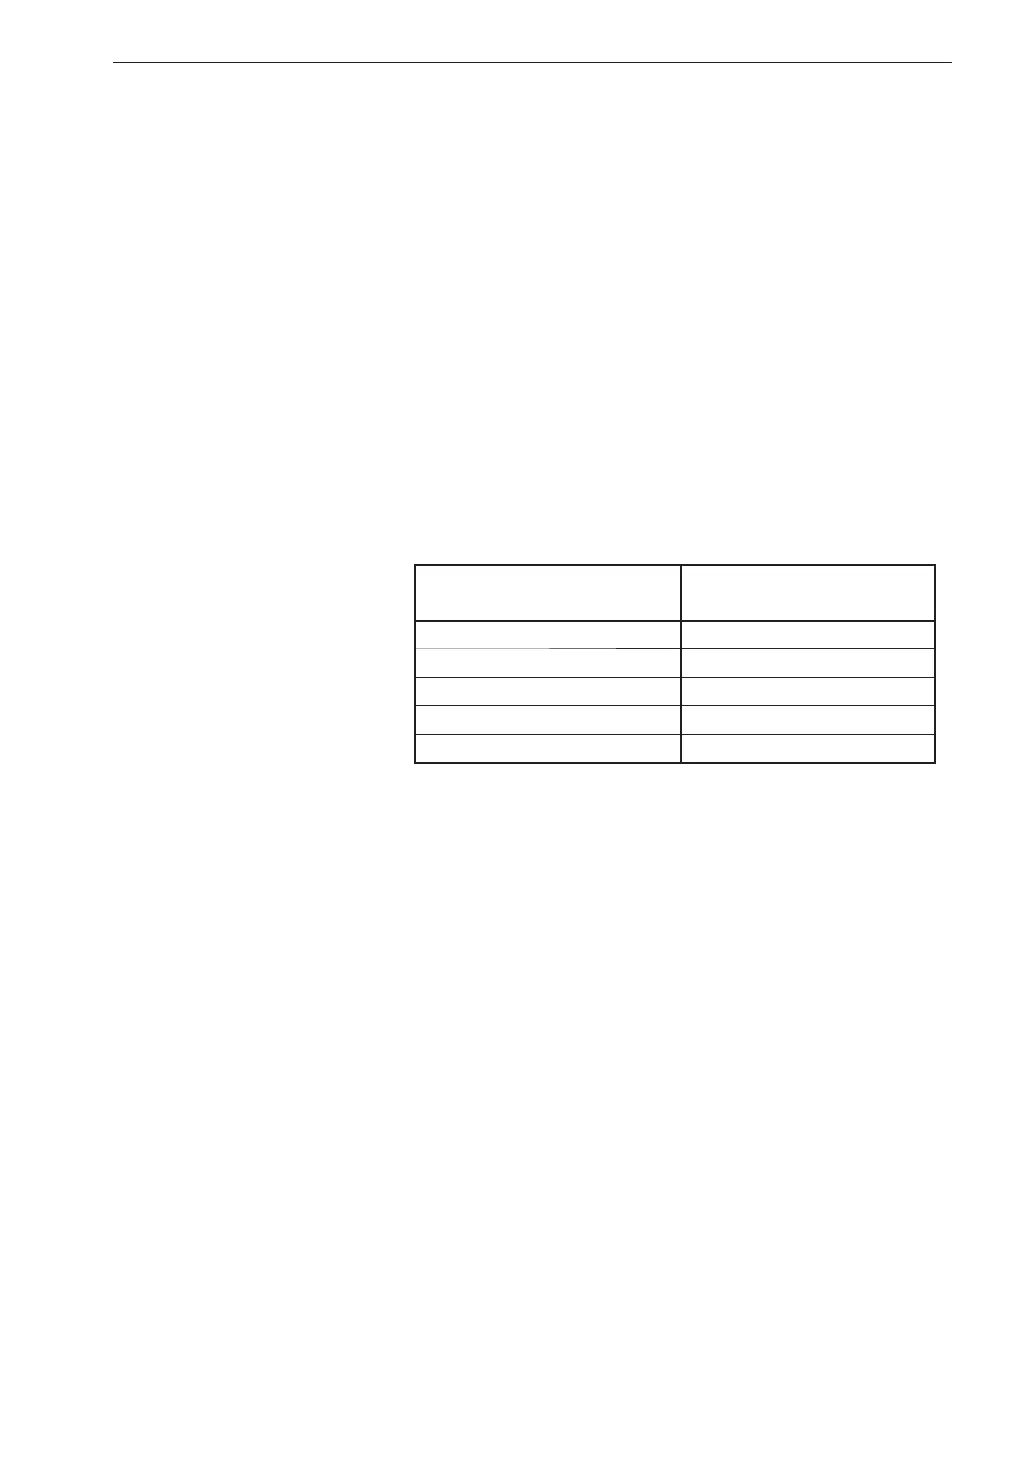
Zoom function allows expansion of display
according to number of analysis lines, as
shown in table below.
Number of analysis lines
(waveform samples)
Zoom factor
(power of two)
200 (512) ×1
400 (1024) ×1 to ×2
800 (2048) ×1 to ×4
1600 (4096) ×1 to ×8
3200 (8192) ×1 to ×16
Y axis: Log, Linear
Log display range:
80 dB, 60 dB, 40 dB, 20 dB
Linear zoom function:
1 to 2
10
(power of two)
Overlay display function:
For comparison of measurement data
and selected store data (all settings for
measurement data type, frequency span,
and number of analysis lines must match)
List display:
Alphanumeric indication of 10 highest level data on graph
display with corresponding frequencies (excluding DC)
Cursor value:
X axis: Hz, kcpm, order
Y axis: Linear (m/s
2
, mm/s, mm), Log
 Loading...