Instructions for Use
Resting & Stress ECG with seca
ct330/331 and seca diagnostic 5.9
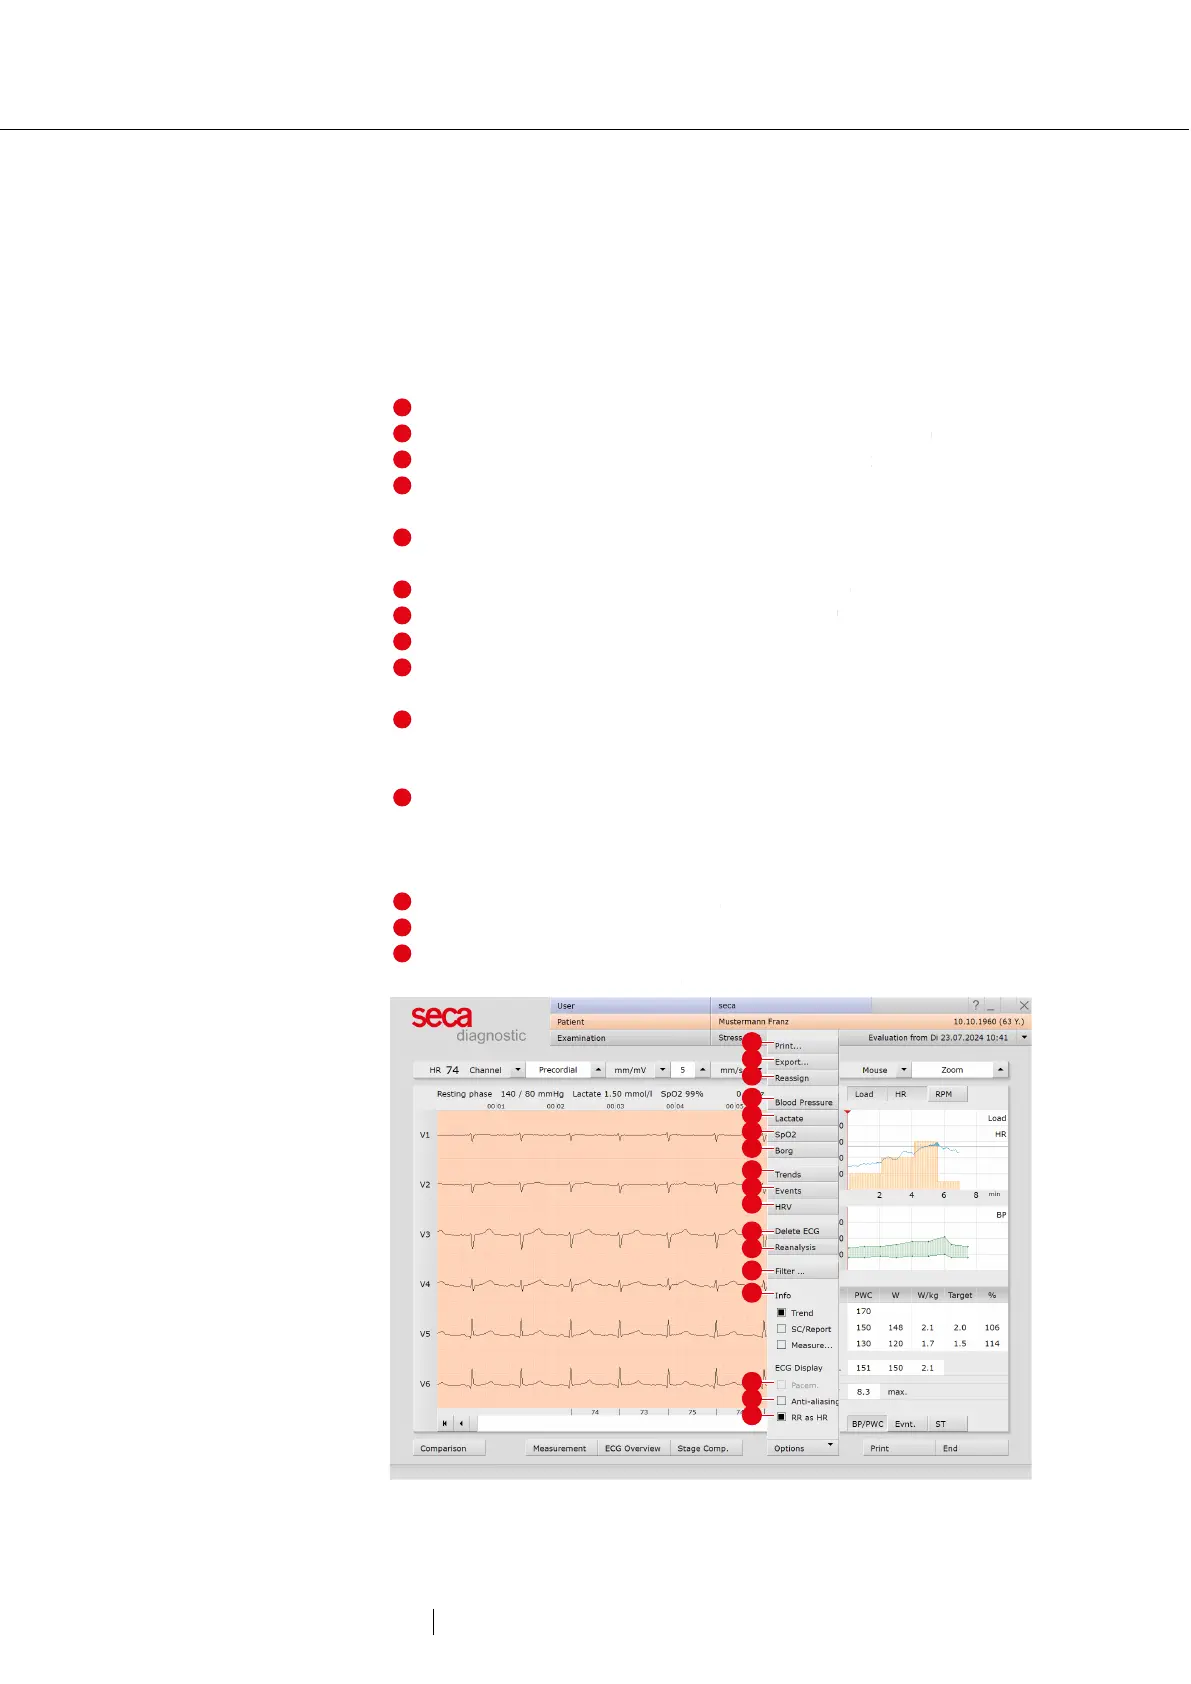
Options menu
The scope and contents of the options menu change depending on
which screen of the evaluation you are on. On the Measurement screen,
for example, you can activate the display of ST values in the options
menu and set which markers are to be displayed in the summary
complexes.
Print menu for temporary changes to the print settings
Export of the evaluation (e.g., as Excel, PDF, DICOM...)
If necessary, assign evaluation to another patient
Display of blood pressure (F9), lactate (F10), SPO2 (F11) and
Borg values (F12)
Trend graphics, e.g., for load, HR, ST, RPM, blood pressure,
lactate, SPO2...
HR trend, display of events in ECG (e.g., VES)
Tables and graphics for heart rate variability
1)
Delete ECG: unmarked ECG will be deleted
New analysis of ECG signal for resetting manual changes in
ECG, additions to the report remain available
Switching on and off filters in ECG (options: Display ECG as
saved, unfiltered or filtered ECG - mains filter, muscle filter, ergo
Showing and hiding of additional contents in the right half of the
screen: summary complexes and report or measured value table
(preset: Trend = stress profile with HR and blood pressure curve,
Show or hide pacemaker spikes
Graphic flattening of ECG signal
In the bar below the ECG the heart rate is displayed instead of
RR intervals in milliseconds
Fig. 42: Evaluation of stress ECG, Options menu
1) For the RR variability to be
displayed, at least five minutes
of ECG needs to be recorded!